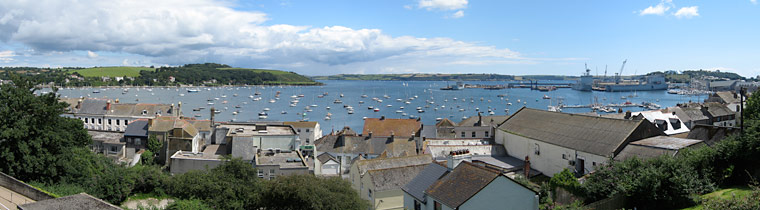
The aim of the work in the Fal Estuary was to gain an understanding of how it behaves as a transition zone, in terms of its biological, chemical and physical properties, between the freshwater input and the coastal sea.
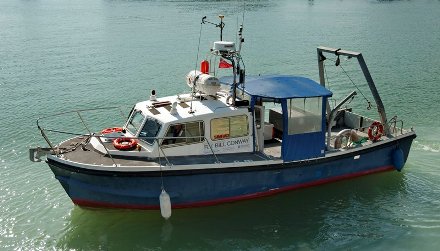
The RV Bill Conway was taken out on the Fal Estuary to collect data on the physical properties of the water column using a CTD and ADCP. In addition, water samples were collected from the CTD rosette to be taken back to the lab for analysis. Finally, a plankton net was lowered to collect samples of phytoplankton and zooplankton.
The CTD was prepared to be lowered by washing and zeroing the transmissometer and
ensuring the water sampling bottles were ready to be fired. It was then lowered to
a few metres from the bottom of the water column before returning to the surface.
It was then lowered to the bottom again, where two bottles were fired. Two successive
bottles were fired at a mid-
To collect oxygen samples, water was collected from the general water sample bottles, and placed into glass sample bottles. These sample bottles were flushed by overfilling the bottle for 5 seconds before then completely filling the bottle with a sample. The samples then had 1ml manganese chloride added followed by 1ml alkaline iodine to preserve them while they were stored for lab analysis. The bottle was then closed and it was stored in water to stop any contamination of the sample. Due to a limited number of sampling bottles, samples were not taken at all of the stations.
To collect samples for the nitrate, phosphate and silicon, water was collected from the general water sample bottles for each of the different depths. A syringe was then cleaned with the sample, before 50ml was drawn up in the syringe. A filter was then attached and cleaned using some of the sample water before 25ml of sample water was filtered into a plastic sample bottle for the silicon water sample. A plastic bottle was used as opposed to glass to stop any contamination of the sample. The rest of the sample was then collected into a glass sample bottle to be used for nitrate and phosphate analysis. The filter from the syringe was removed and stored in acetone ready for analysis of chlorophyll in the lab. Another 50ml was taken up in the syringe with a new filter to make up the rest of the nitrate and phosphate samples. Again the filter used was stored in acetone for analysis of chlorophyll in the lab.
An ADCP transect was then taken across the estuary at each of the 7 stations. A secchi disk measurement was also taken at each station by lowering the disk into the water and then taking a measurement for the depth at which it could no longer be seen.
Finally, at stations 1, 4 and 7, 200µm mesh diameter zooplankton nets were trawled behind the boat for approximately 5 minutes. The samples collected were then transferred into plastic bottles for storage.
Estuarine
BIOLOGICAL LAB ANALYSIS
Sedgewick-
For zooplankton counts 10ml of the 1 litre sample was taken and put into Bogorov counting chambers and abundance and species identified.
Oxygen Analysis
The analysis of the oxygen samples in the lab involved adding 1ml sulphuric acid, which was mixed in using a magnetic mixer, to the oxygen samples that we had collected. This was then analysed using a Winkler Titration System which titrated the sample against thiosulphate.
Nutrient Analysis
Silicon, phosphate and nitrate samples were analysed using standard procedures for sea water (Lohrer et al, 2004).
Chlorophyll Analysis
To analyse the chlorophyll samples each sample was run through a 10 AU flourometer to give a chlorophyll reading per 50ml.
An equation was used to convert the fluorometer reading for chlorophyll, which is for 6ml, to the total amount of chlorophyll in the 50ml sample.
References
- Lohrer, A. M., Thrush, S. F., & Gibbs M.M., (2004), Bioturbators enhance ecosystem
function through complex biochemical interactions, Nature, 431, 1092 -
1095.
- Roubeix, V., Rousseau, V. and Lancelot, C. (2008) Diatom succession and silicon removal
from freshwater in estuarine mixing zones: From experiment to modelling. Estuarine
Coastal and Shelf Science, 78 (1), 14-
26. - University of Southampton, [Online], n.d., Available: http://www.southampton.ac.uk/oes/research/facilities/research_vessels/conway.page [Last accessed: 4th July 2014
Disclaimer -
R.V.Conway
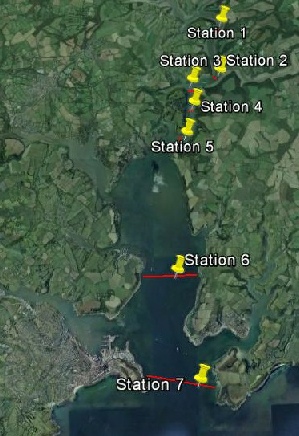
Figure 1-
Meta Data
Date:27/06/2014
Time: 07:15-
Location: Fal Estuary
Weather: Cloud cover 5/8
Wind speed: 3.6 m/s
Sea State: Calm
Tide: Low Water: 00:28 (0.8m)
High Water: 06:02 (4.7m)
Low Water: 12:47 (0.8m)
High Water: 18:18 (4.9m)
Vessel: RV Bill Conway
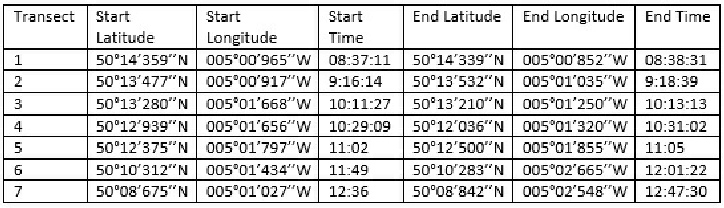
Table showing the start and end location and time for the seven transects completed along the Fal estuary