The pontoon data collection involved taking seawater samples for chlorophyll measurements, collecting YSI multiprobe data and recording the current flow using a flow meter. The data collected on the pontoon was useful to determine the change in current flow and chlorophyll concentrations in the same place over a tidal cycle. The aim was to produce a time series of data over the two week period from Monday 23rd June to Saturday 5th July by combining with the data collected from the other groups.
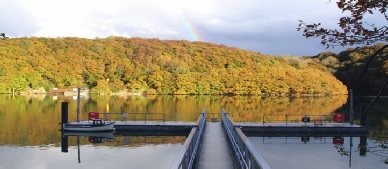
Pontoon
Meta Data
Date: 27/06/2014
Time: 11:30-
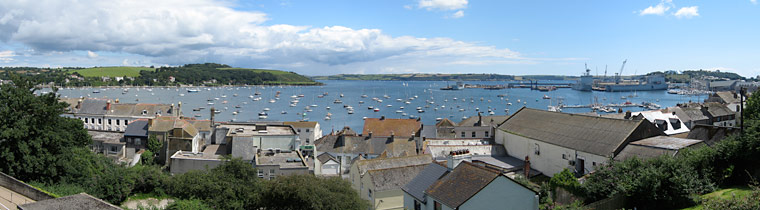
Location: King Harry Pontoon
50°08.682 N
005°01.661W
Weather: Cloud cover 5/8
Tide: Low Water:00:28 (0.8m)
High Water: 06:02 (4.7m)
Low Water: 12:47 (0.8m)
High Water:18:18 (4.9m)
For the chlorophyll samples, a syringe collected a 50ml sample of seawater which
was then passed through a filter. The filter paper was then removed from the syringe
and placed in a test tube containing 6ml of acetone. Plastic gloves were used when
placing the filter paper in the acetone. Two samples were taken at each 30 minute
interval, and hence two filter papers were collected and put into separate tubes
containing acetone.
For the YSI multiprobe measurements, it was placed into the water and the data was recorded at 1m depth intervals, until the bottom, where a measurement was taken half a meter off the bottom. The depth of water changed over the course of the day with low tide at 11.47 UTC. Each time the measurements were taken the depth was measured using markers on the flow meter cable. The current flow was measured by placing the current meter into the water and recording the flow of the current. The measurements for the current flow, the YSI multiprobe and the chlorophyll samples were all taken at each 30 minute interval from 08.30 to 15:00 UTC.
REFERENCES
- FalRiver Cornwall, [Online], n.d., Available: http://www.falriver.co.uk/information/webcams [Last accessed 4th July 2014].
Disclaimer -
King Harry’s Ferry Pontoon
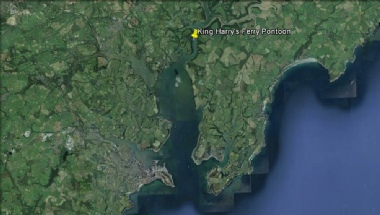
Figure 1 : Map showing the location of King Harry’s Ferry Pontoon