Pontoon Results
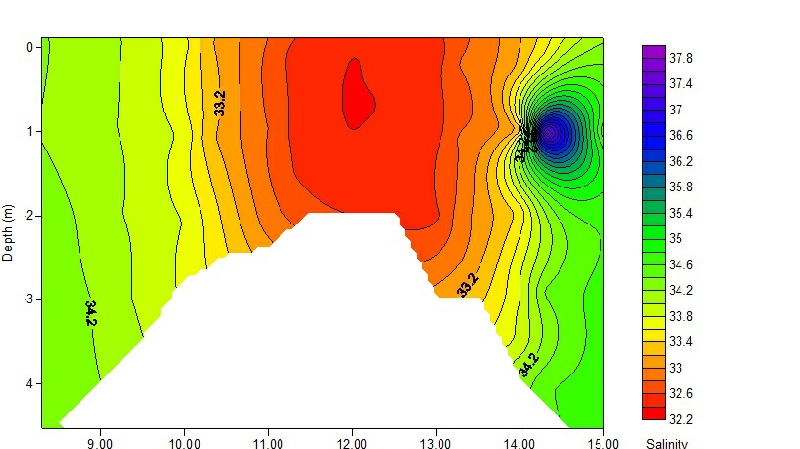
A) Salinity contour
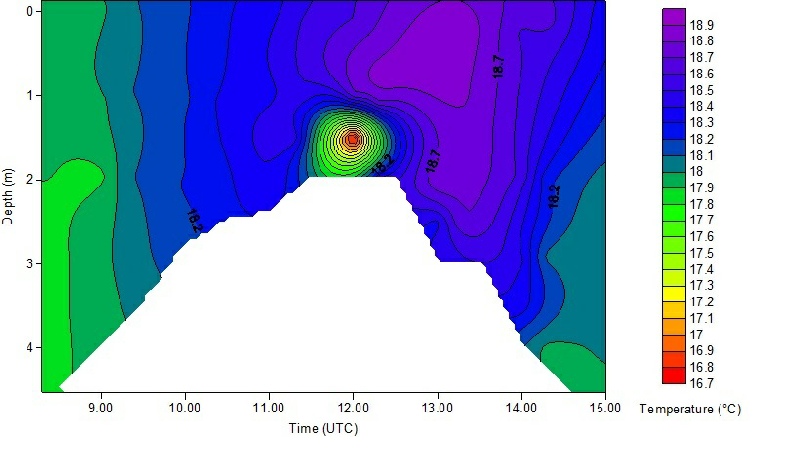
B) Temperature contour
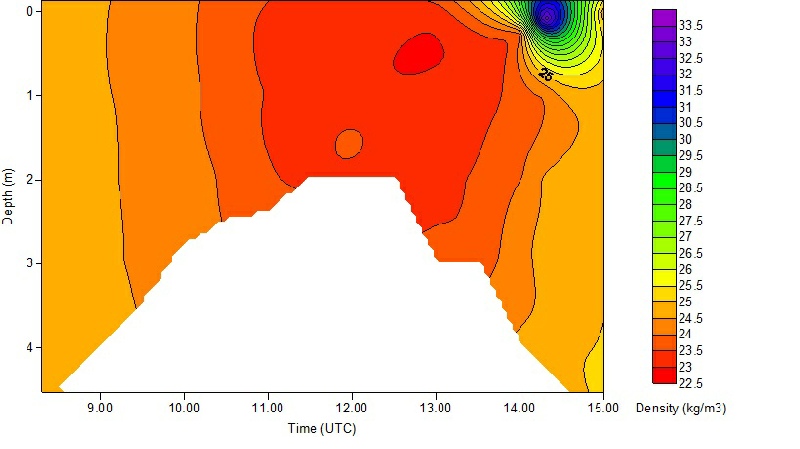
C) Density contour
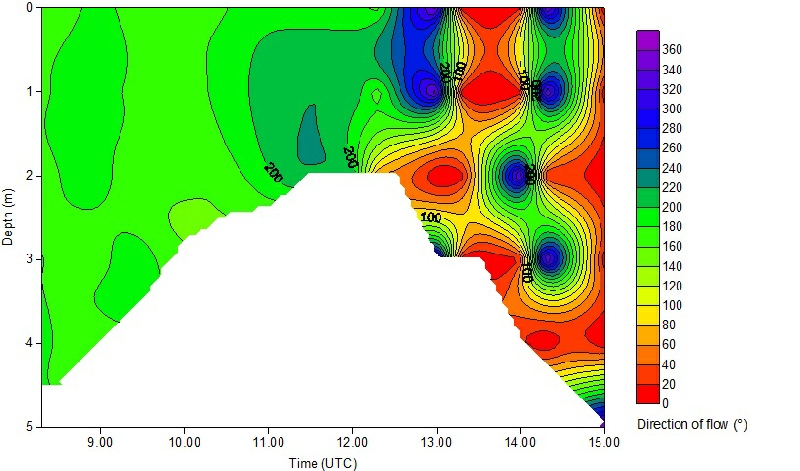
E) Water Direction contour
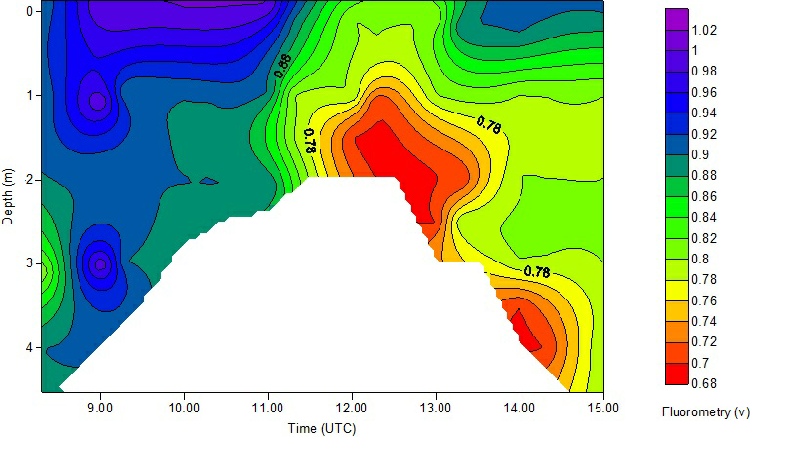
F) Fluorometry contour
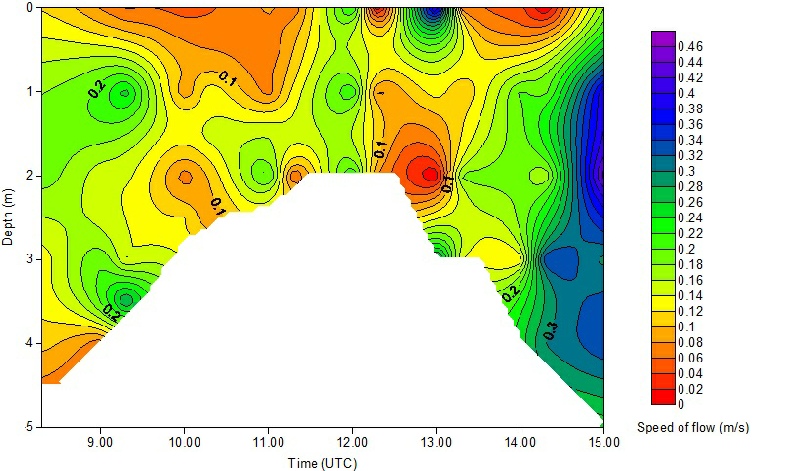
D) Water Speed contour
Figures 1 A-
For figure 1A, the salinity was found to be lowest at low tide (32.2) between 0-
For figure 1B, the temperature then rapidly increased and is highest (18.9°C) between
12:00 and 13:30 UTC at a depth of 0-
For figure 1C, the lowest density of 22.5 kgm³ is found at low tide, at 12:00 UTC. The density then increased as the tide increased, with the higher densities being found at high tide (24.g kgm³). The density of the water was highest between 14:00 and 15:00 UTC around 0m depth. The density then rapidly decreased to a similar density (25 kgm³) as the surrounding water at 1m depth.
The data for figure 1D ranges from 08:00 UTC (high tide) to 15:00 UTC (high tide),
with low tide occurring at 12:00 UTC. The greatest speeds of flow of 0.46 ms were
found between 14:00 and 15:00 UTC, ranging from 1-
The data for figure 1E shows that between 08:30 and 12:00 UTC, the direction of
the flow was around 180°. The direction of flow was around 280° at 12:30 UTC between
0 and 1.5m depth and between 14:00 and 14:30 UTC at depths of 0, 1, 2 and 3m. The
direction of the flow was 0° around 14:00 at 0-
For figure 1F, fluorometry readings were lowest on the flooding tide between 12:30 and 13:00 with a reading of 0.68v and at 14:00 with the same reading. The highest reading was at the surface between 10:00 and 11:00 UTC. Generally, the fluorometer readings were lower on the ebb tide before low water than on the flooding tide after low water.
For the salinity, temperature, density, speed, direction , and fluorometry contour
figures (figures 1a-
Figure 2 illustrates a time series for percent of dissolved oxygen at two different depths. Data takes on the 27/06/2014 between 8:30 and 15:00 UTC.
(Click individual graph to enlarge).
Figure 2 shows a time series of dissolved oxygen from 08:30 to 15:00 UTC. In general, the pattern of dissolved oxygen increased with time, however there was a greater increase within surface waters than at the bottom of the water column. Generally, the dissolved oxygen followed a similar pattern in the surface waters and at the bottom of the water column. However, after 14:00 UTC the dissolved oxygen concentration in the surface waters (130%) was far greater than at the bottom of the water column (117%).
Disclaimer -
