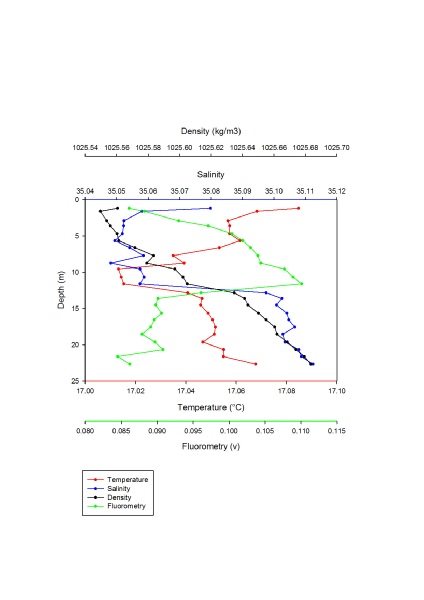
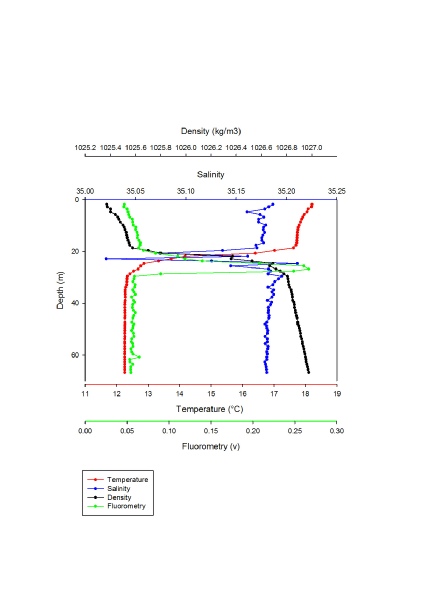
A) Station 61
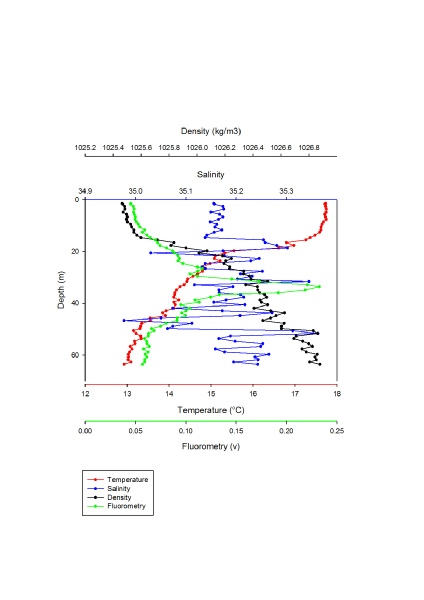
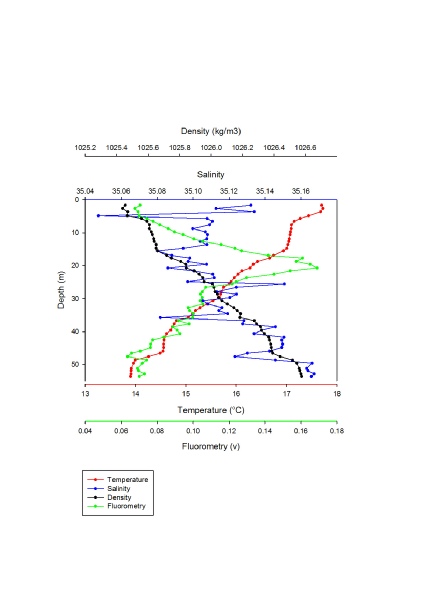
B) Station 62
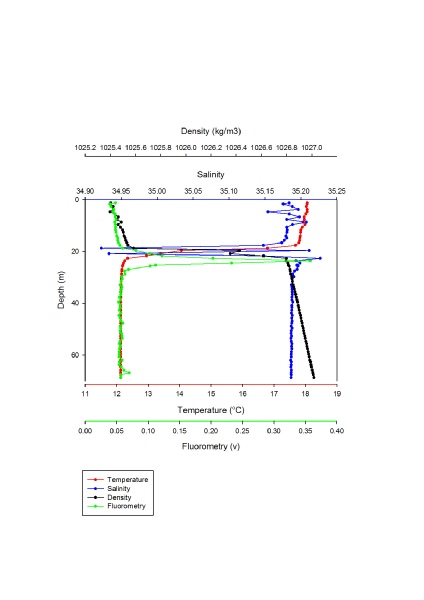
C) Station 64
D) Station 66
E) Station 67
Figure 1 A-
(Click individual graphs to enlarge).
For figure 1A at station 61, there was an initial decrease in temperature with depth
from roughly 17.08°C at 1m depth to roughly 17.01°C at 10m depth. There was then
an increase in temperature with depth between 10m and roughly 23m, with the highest
temperature at 17.07°C. There was an increase in fluorometry between 1m and 12m depth
followed by a rapid decrease and then a steady decrease. The fluorometry data was
lowest around 0.85 V at 1m and 23m and it was highest at 17.09 V. The salinity data
decreased from 35.08 at 1m and fluctuates between 35.05 and 35.06 between 2-
For figure 1B at station 62 there was a decrease in temperature between almost 18°C at the surface to 13°C just over 60m depth, with an exponential decrease within the first 20m of the water column. There was a steady decrease in fluorometry between the surface (0.05 V) and roughly 30m at 0.10 V followed by a rapid increase to roughly 0.23 V and then a rapid decrease back down to 0.10 V at 40m. There was then a steady decrease back down to 0.05 V at just over 60m. The salinity fluctuated between the surface and around 60m, resulting in a slight overall decrease between the surface (roughly 35.15) to around 60m (roughly 35.25). The density decreased between the surface (1025.4 kgm) and 60m (1026.8 kgm).
For figure 1C at station 64 the temperature slowly decreased from 18°C at the surface to just below 18°C at 20m and then rapidly decreased at the thermocline to 12°C over a few metres. The temperature then remained constant at just over 12°C until the bottom of the water sampled. There was a slow increase in fluorometry from the surface (0.05 V) to roughly 20m, where there was a sudden increase to around 0.35 V at roughly 25m. This was followed by a decrease back to just over 0.05 V at roughly 30m. The fluorometry was then constant from 30m to the bottom of the water column sampled. The salinity fluctuated between the surface and just above 20m, where it then rapidly decreased to around 34.92 at 20m and then increased back to roughly 35.18, where it remained constant to the deepest water sampled. The density increased slightly to 20m and then rapidly increased to around 25m, followed by a steep increase to the deepest water sampled.
For figure 1D at station 66 the temperature slowly decreased between the surface and 20m, followed by a rapid decrease at the thermocline to roughly 13°C at 25m. It then steadily decreased to 30m and then remained constant until the bottom of the water column sampled. The fluorometry increased slightly between the surface and 20m, followed by a rapid increase from 35.05 V to 35.23 V and then decreased back to 35.05 V. It then remained constant at 35.05 V from 30m to the deepest water sampled. The salinity steadily decreased to 20m, followed by a rapid decrease to 35.02 salinity. The salinity then remained constant with depth to the where the bottom sample was taken from. The density showed a similar pattern to salinity. The density first increased slightly with depth then increased rapidly, followed by a steady increase to the bottom of the water column.
For figure 1E at station 67 the temperature decreased gradually between the surface at just below 18°C to just over 50m and around 14°C. The fluorometry gradually increased from 0.07 V at the surface to 0.17 V at roughly 20m, followed by a gradual decrease to 0.07 V at just over 50m. The salinity initially decreased from 35.13 to 35.05, followed by a decrease to 35.16 at just over 50m. The density gradually increased from 35.06 at the surface to 35.16 at the bottom of the water column sampled.
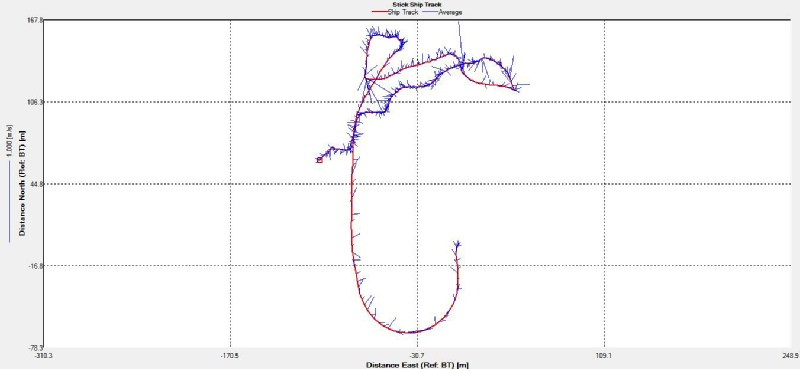
A) Station 61 Ship Track
B) Station 62 Ship Track
C) Station 64 Ship Track
D) Station 66 Ship Track
E) Station 67 Ship Track
Figures 2 A-
(Click individual graphs to enlarge).
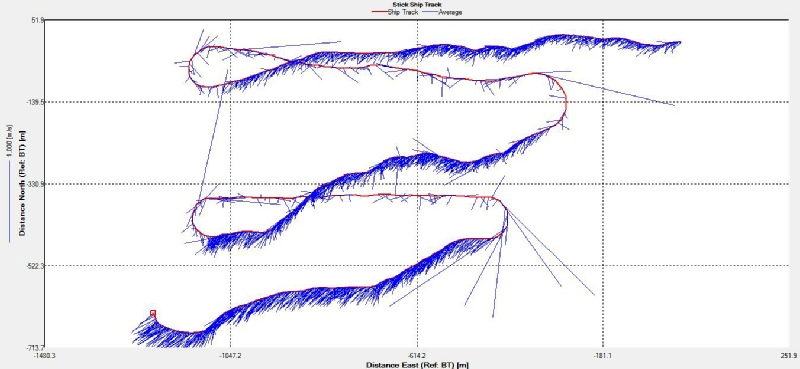
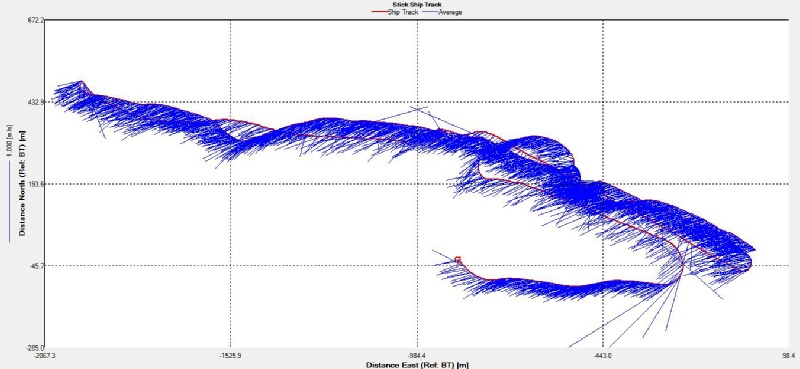
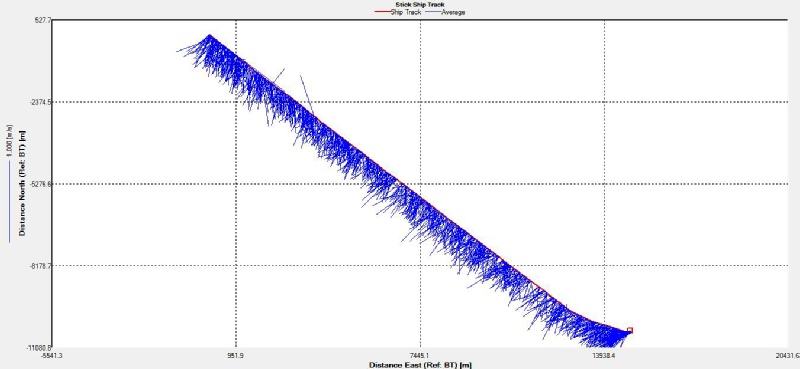
A) Transect 1 Ship Track
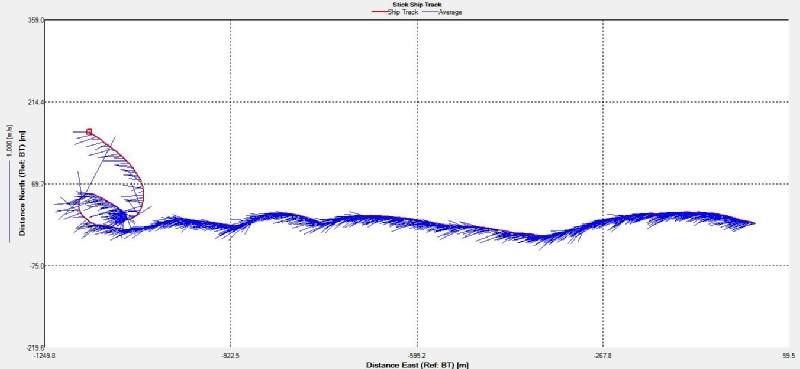
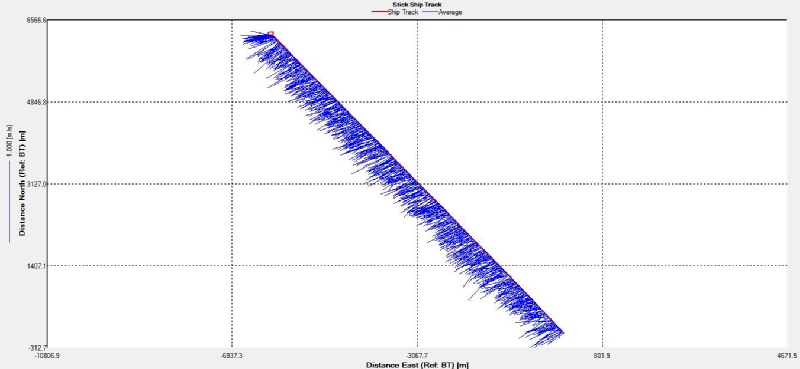
B) Transect 2 Ship Track
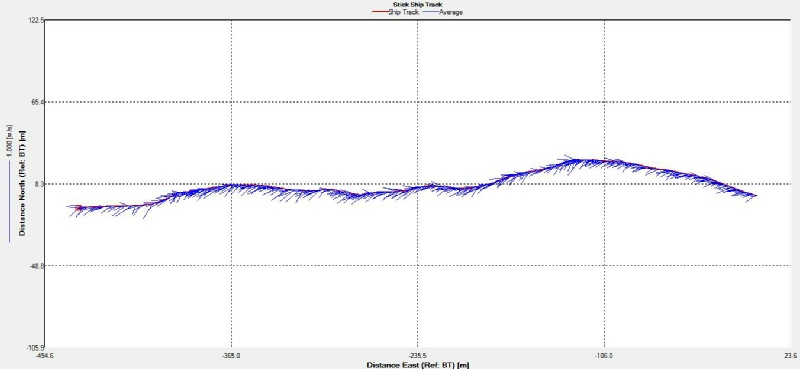
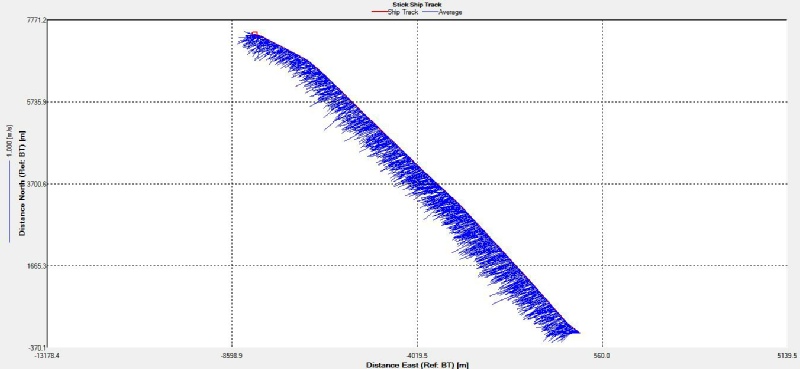
C) Transect 3 Ship Track
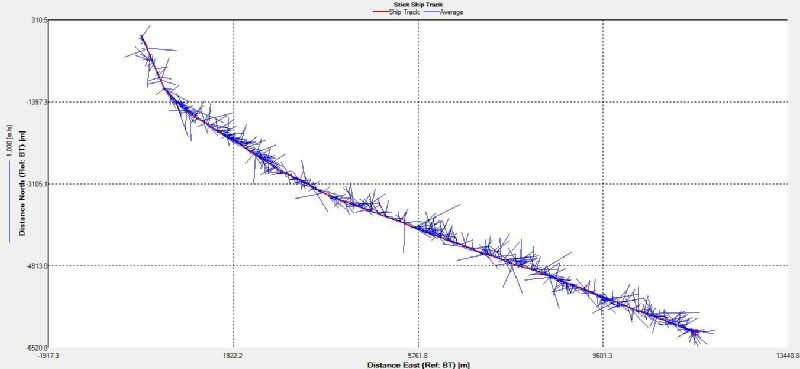
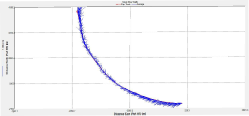
D) Transect 4 Ship Track
E) Transect 5 Ship Track
Figures 3 A-
Figures 4 A-
(Click individual graphs to enlarge).
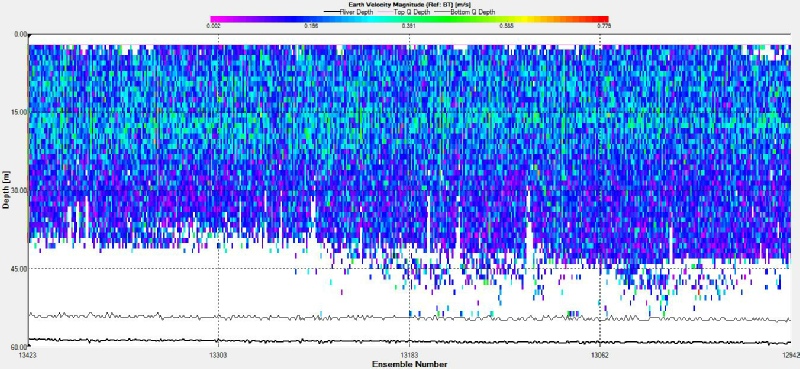
A) Station 61 Velocity Contour
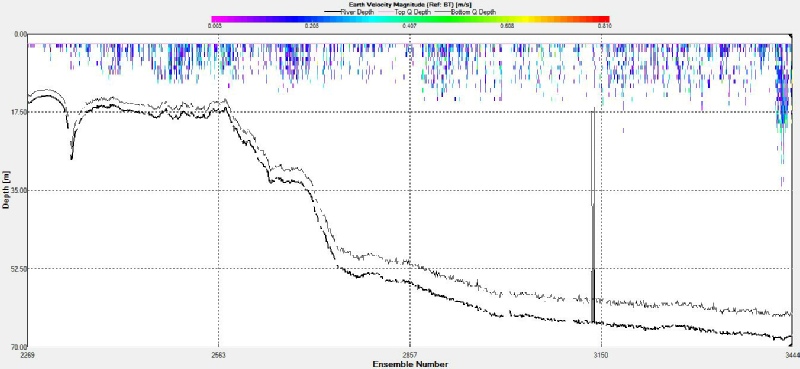
B) Station 62 Velocity Contour
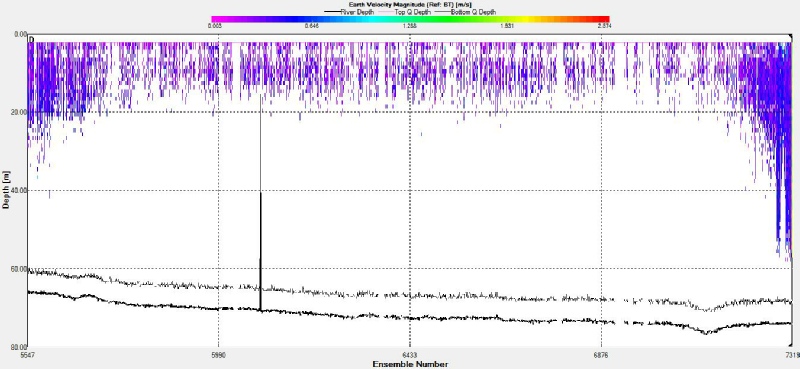
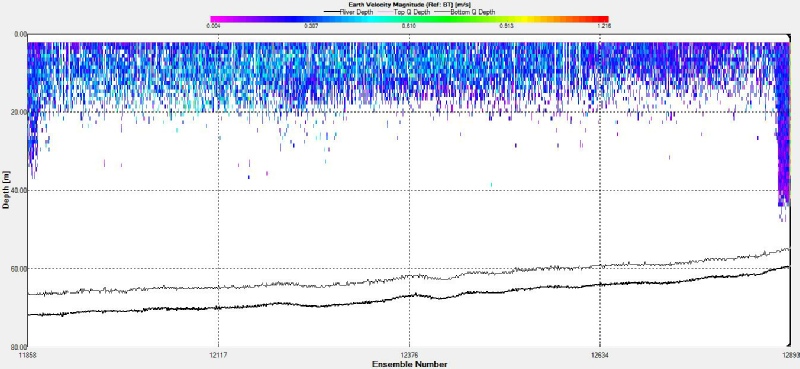
C) Station 64 Velocity Contour
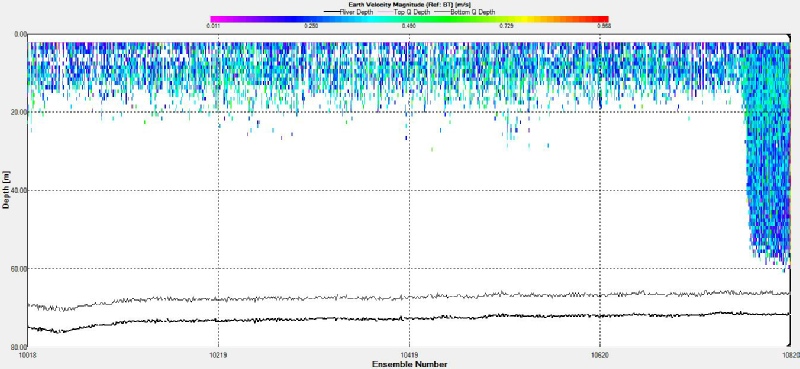
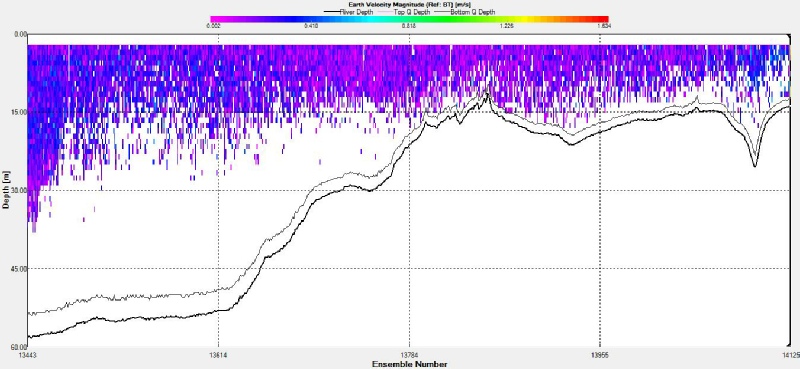
D) Station 66 Velocity Contour
E) Station 67 Velocity Contour
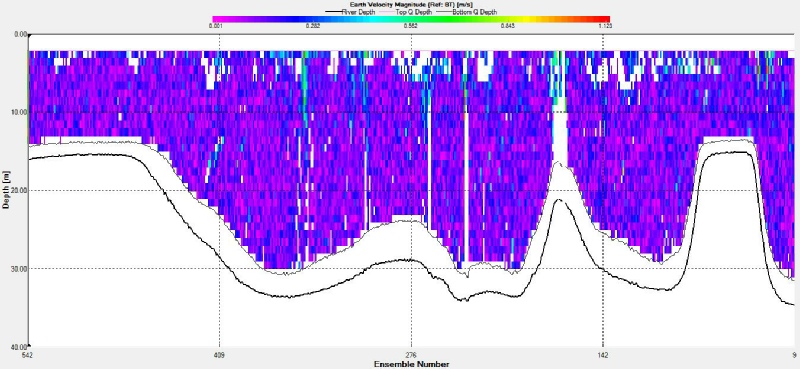
A) Transect 1 Velocity Contour
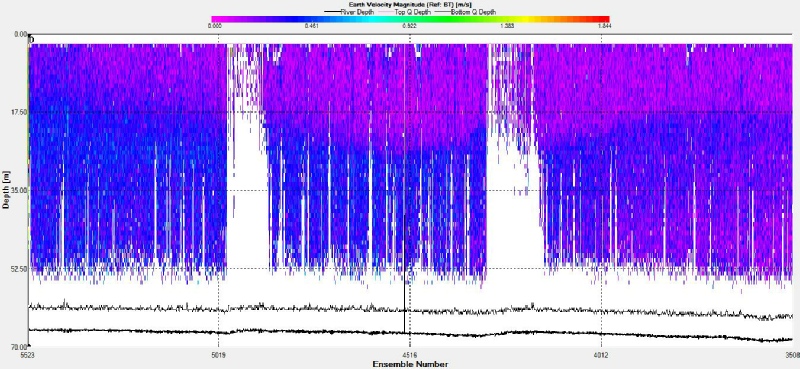
B) Transect 2 Velocity Contour
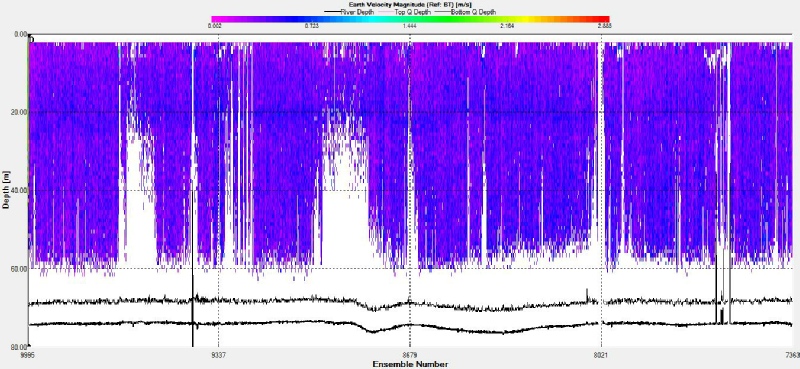
C) Transect 3 Velocity Contour
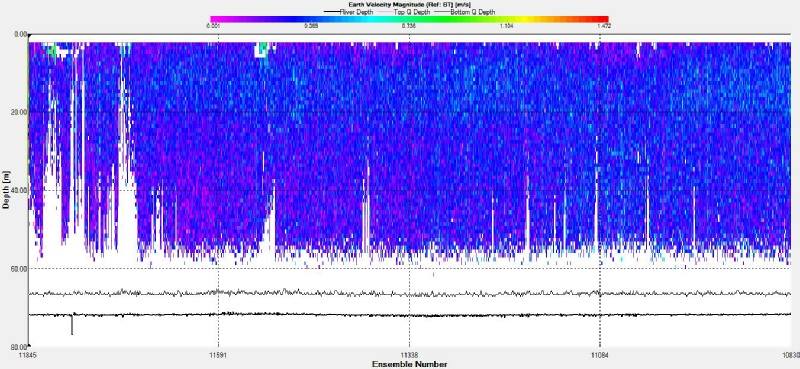
D) Transect 4 Velocity Contour
E) Transect 5 Velocity Contour
Figures 5 A-
(Click individual graphs to enlarge).
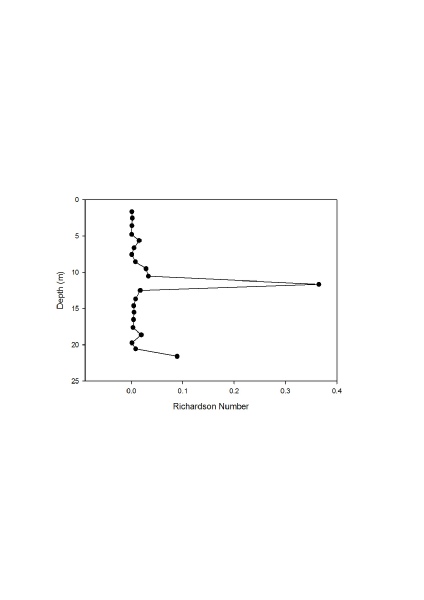
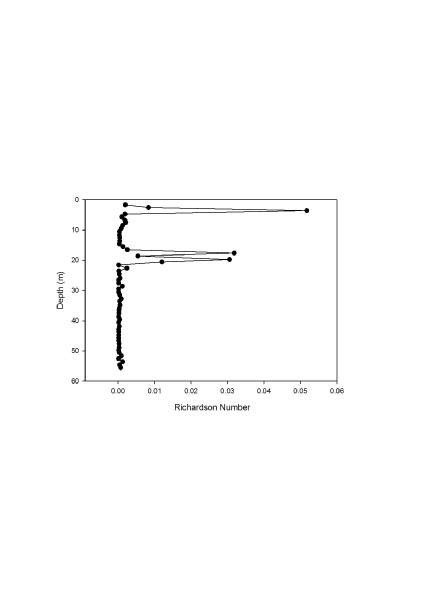
A) Station 61
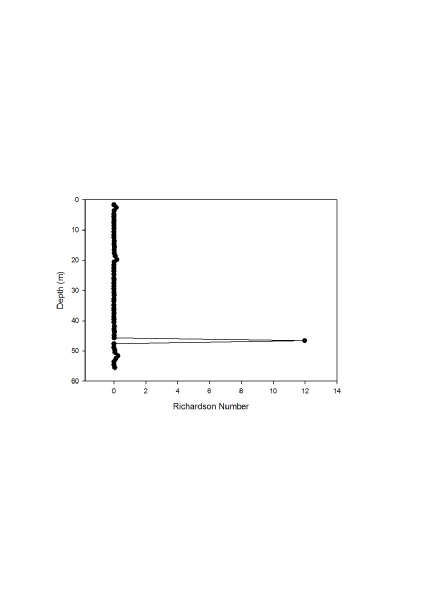
B) Station 62
C) Station 64
Figures 6 A-
(Click individual graphs to enlarge).
Physical Offshore Results
Stations ship tracks
The current velocity represented in figure 2A is shown to be ~0.1m/s, which is slower than the expected ~0.6m/s according to Tidal Diamond F. Direction of flow is inconsistent at this station.
The current velocity at station 62 (figure 3B) is shown to be 0.05-
In figure 2C, current velocity is shown to be 0.2-
Current velocities are 0.2-
The current velocities 67 (figure 2E) at station are 0.1-
Stations velocity profiles
Current velocity in figure 4A is shown to be 0.05-
Figure 4B shows that current velocity is shown to be 0.05-
Figure 4C shows the velocity Contour for data collected with ADCP whilst on Station
64, the third of our stations, on 02/07/2014 from 13:20:39 to 15:04:28. Current velocity
is shown to be generally 0.25-
Current velocities at station 66 (figure 4D) are 0.1-
The current velocity differs over the water column at station 67 (figure 4E), with
0-
Transects velocity profiles
Figure 5A shows the Velocity Profile taken for transect 1. Data display and interpretation
is limited, due to 91% Bad Bins. For the values recovered, flow is seen to be 0.1-
Figure 5B shows the Velocity Profile taken for transect 2. Data display and interpretation
is limited due to 86% Bad Bins. For values recovered, flow is seen to be 0.1-
Figure 5C shows the velocity profile for transect 3. Data display and interpretation
is limited to 82% bad bins. For values recovered, flow was seen to be 0.2-
Figure 5E shows velocity profile for transect 4. Current velocities are ~0.3m/s which was in keeping with tidal diamond F which suggests velocities of 0.25m/s for the sample period. Due to the large amount of bad bins on this transect, data interpretation was not possible at depths past ~20m, although the maximum depth is ~70m.
Figure 5E shows velocity profile for transect 5. Current velocities appear to be
0.05-
Transects Stick ship Track
Figure 3A shows the Stick Ship Track taken for transect 1. Data display and interpretation is limited due to 91% Bad Bins. For the data displayed, the flow appears to be ~0.3m/s, which is about what is expected according to the nearest Tidal Diamond which suggests a flow of 0.36m/s reducing to slack over the survey period. The Tidal Diamond also suggests an expected net flow at 40°. This is observed when averaging data.
Figure 3B shows the Stick Ship Track taken for transect 2. Data display and interpretation
is limited due to 86% Bad Bins. For the data displayed, the flow appears to be ~0.3m/s.
This is fitting with the Tidal Diamond (50°02’.5N 004°58’.8W) of 0.26-
Figure 3C shows Stick Ship Track for Transect 3. Current velocity appears to be ~0.4m/s, which was in keeping with Tidal Diamond F. The direction of flow is also in keeping with Tidal Diamond F. Data interpretation was limited due to 82% bad bins. Maximum sampling depth was ~20m, so Stick Ship Track data is not representative of the whole water column.
Figure 3D shows stick ship track for transect 4. Current velocities appear to be ~0.3m/s, which was in keeping with the suggested 0.25m/s from tidal diamond F for the sample period. The tidal diamond also suggests a direction of flow of 220° that can be seen in the figure. Due to the large number of bad bins, the stick ship track was only representative of the upper 20m of the ~70m water column.
Figure 3E shows stick ship track for transect 5. Current velocities appear to be ~0.3m/s which was more than expected according to tidal diamond F. This could be due to the lack of data at depths past ~25 as a result of bad bins. The direction of flow was ~260° which was ~30° different to the expected 293° according to the tidal diamond, however this could also be due to the lack of samples over the full depth.
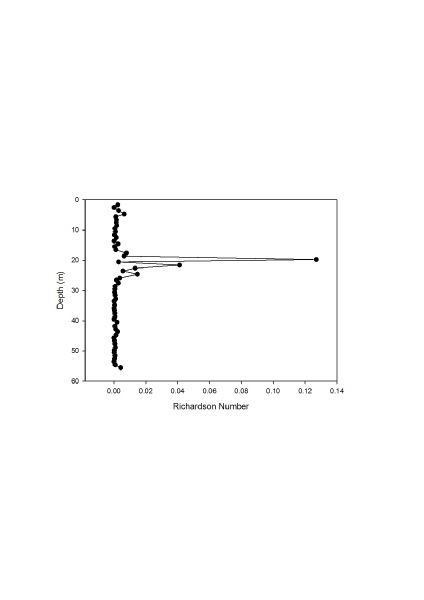
D) Station 66
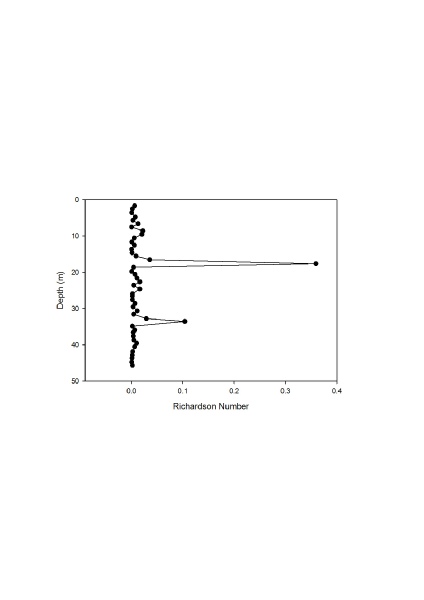
E) Station 67
Figure 6A shows that the Richardson’s Number (Ri) was constant at roughly 0.0 from the surface to 20m depth, indicating a laminar flow. The flow appeared to be turbid at roughly 12m depth at Ri 0.36.
Figure 6B also shows a constant laminar flow of 0 Ri between the surface and roughly 56m depth. The flow was turbulent at roughly 48m depth, with an Ri of 12.
Figure 6C showed that the flow was laminar for the entirety of the water column sampled. The Ri was greatest between the surface and 5m (0.05 Ri) and was followed by 0.03 Ri between 18m and 21m depth. The remainder of the water column had a constant Ri of 0.00.
Figure 6D shows that the flow was laminar between the surface and roughly 56m depth. The Ri was highest at around 20m depth (0.13 Ri), with the remainder of the water column having a constant Ri of 0.00.
Figure 6E shows that the Ri was laminar (0.00 Ri) for the entirety of the water column except between roughly 16 and 19m where the flow was turbulent as it had a Ri of 0.35. at roughly 33m depth the Ri increased to 0.1, however the flow was still laminar
Disclaimer -