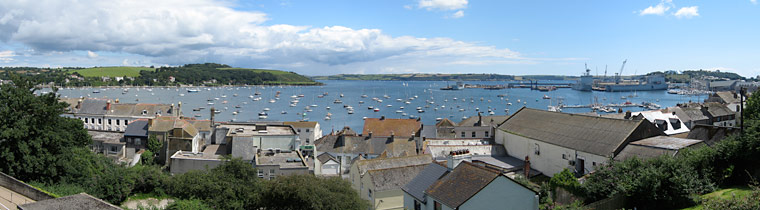
The Fal Estuary is designated a Special Area of Conservation (SAC), which contains some of the largest maerl beds in south west England (Burns & S.A). The Fal is an industrial estuary with many anthropogenic impacts such as sewerage, agricultural runoff and mining tailings. This means that it is important to map the benthic habitats, such as the protected maerl, to see the impact that these activities may be having.
To select an area of the Fal Estuary and produce a benthic habitat map of that area in order to improve understanding of connections between the water column and the sea floor and to understand the sea floor as a benthic habitat.
Geophysics
Meta Data:
Date: 25/06/2014
Time: 08:00 UTC-
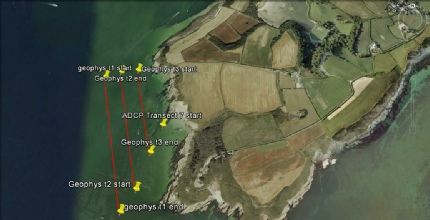
Location: St Anthony’s Head
Weather: Cloud cover 7/8
South westerly wind at 11 knots
Temperature 17°c
Sea state: Large Swells
Tide: High Water-
High Water-
Low Water-
Low Water-
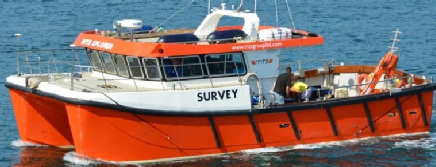
Vessel: MTS Xplorer
Figure 1: Map showing where the three transects were completed.
In conclusion, despite the fact only three transects could be completed, the side scan sonar trace combined with the video transect footage has provided a useful data set which has allowed us to create a habitat map of St. Anthony’s Head. From the habitat map it can be seen that there are a number of different substrates which will provide different habitats for a diverse range of benthic organisms.
SIDE SCAN TRACE HABITAT MAP
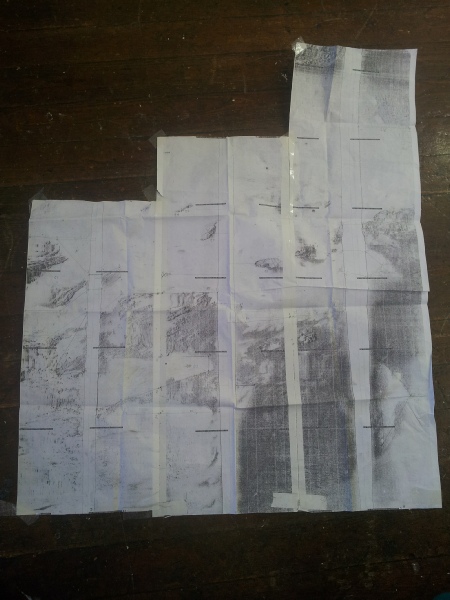
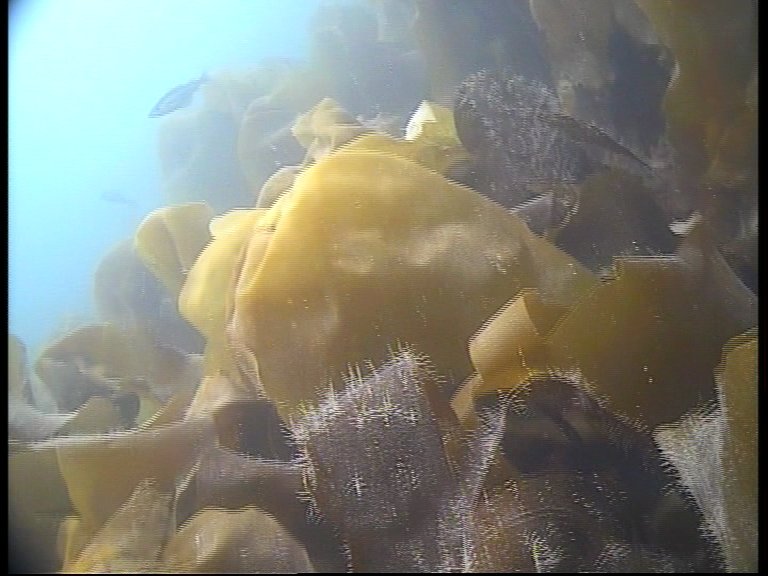
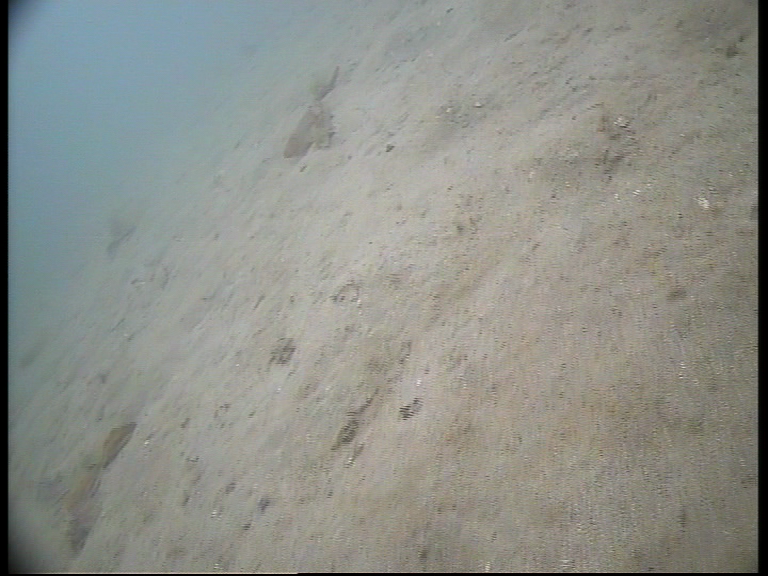
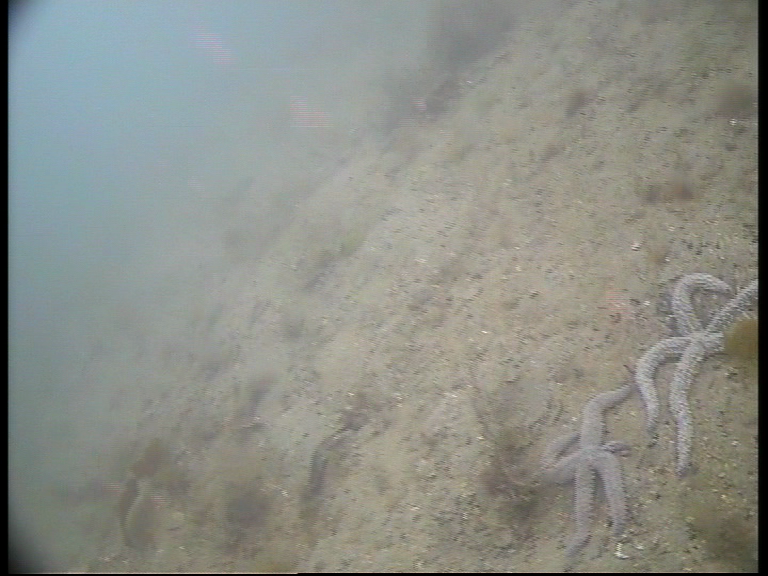
Figure 2-
(Click photo to enlarge).
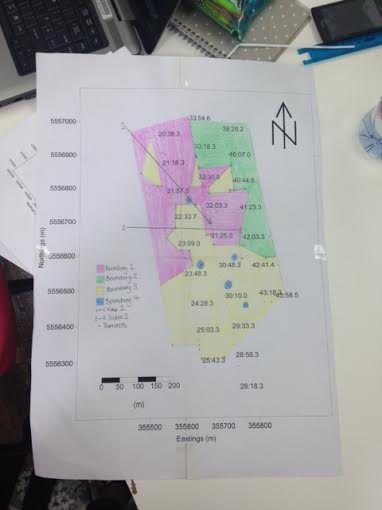
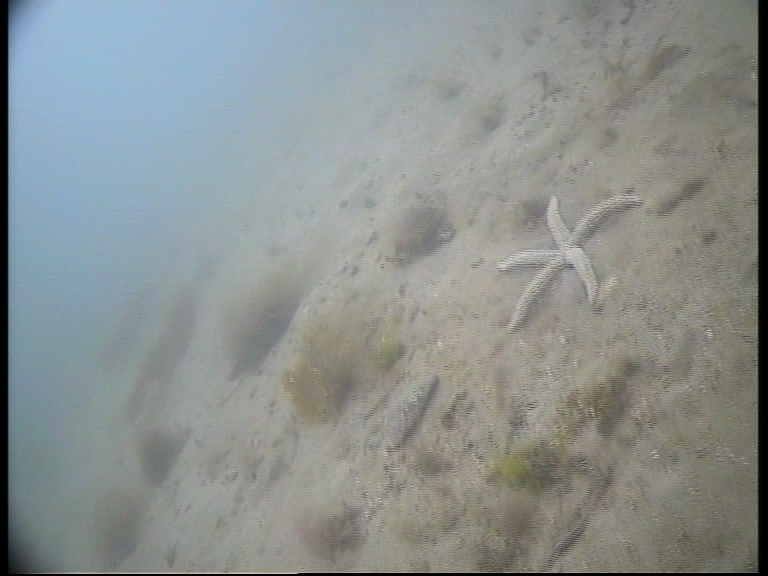
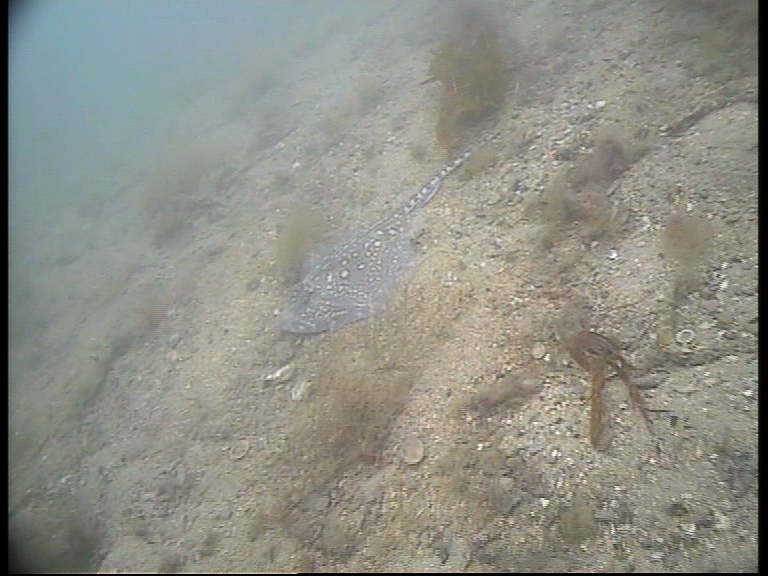
Figure 3-
(Click photo to enlarge).
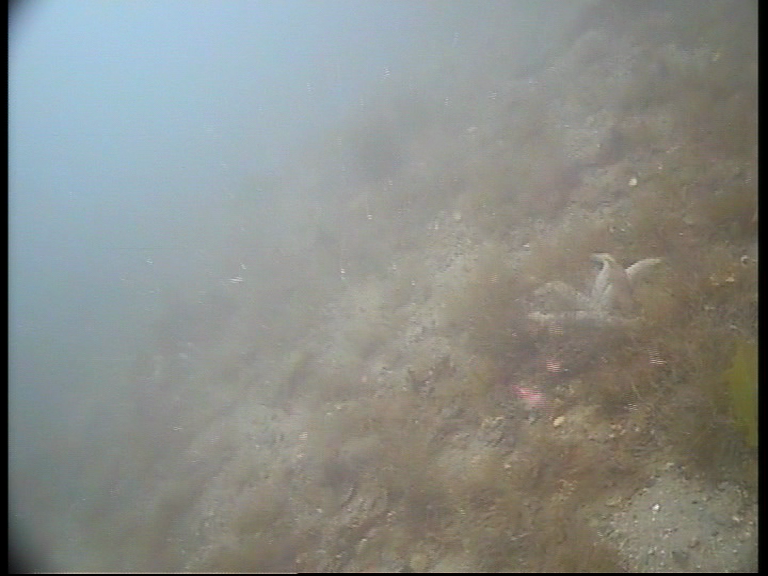
Figures -
REFERENCES
- Burns, S.A., n.d., Mapping of Maerl Specieswithin the Fal and Helford Special Area
of Conservation, [Online], Available: http://stephburnsfameproject.weebly.com/journal-
article.html , [Last accessed: 1st July 2014].
2. Marine and Towage Services, [Online], n.d., Available: http://www.mtsgroupltd.com/vessels/fastcat/mts-
Disclaimer -
METHODOLOGY
Four transect lines were plotted on the hydropro navigation equipment in the St Anthony’s
Head area. The M.TS. Xplorer then towed a side-
A drop video camera was then used as a second method to survey the seabed. Two transects were plotted across the area covered in the side scan survey. The boat was then allowed to drift across the transect lines. The footage captured from the video was recorded onto a DVD.
In the lab the side scan trace was analysed to produce a habitat map. This was done by creating boundary zones. The location of the boundary lines relative to the position of the tow fish was then calculated.
Distance between fish and sea bed (Hf cm) was determined by calculating the distance (cm) between the center of the tow fish line and the first boundary of interest. This is then multiplied by 75m (the distance to the edge of the track from the center) and divided by the distance to the edge of the track from the center (cm).
Slant range (Rs) was then calculated by measuring the distance from the fish to the object and then multiplied by Hf(m)/Hf(cm).
True horizontal distance (Rh) was calculated using Pythagoras.
MTS Xplorer
POSTER