
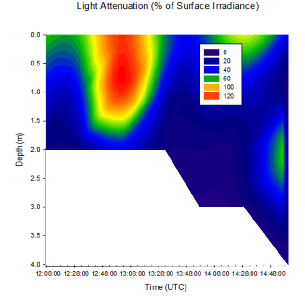
The results for light attenuation are thought to be invalid, likely due to technical problems or human error in recording data. The data between 12:45 UTC – 13:15 UTC doesn’t make sense as the % of surface irradiance exceeds 100% which indicates an addition of light at depth. The data also doesn’t correlate with the weather information we recorded. At 12:46 UTC there was heavy rain and at 13:05 UTC even heavier rain was recorded. This primary information contradicts the results shown in the above graph. `
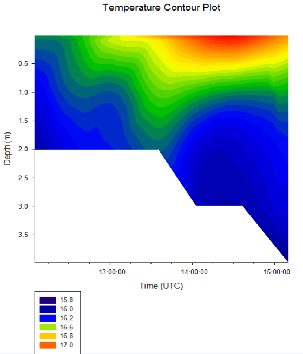
At 12:00 UTC the surface temperature was approximately 16.4oC with insignificant stratification as the water was 16.2 oC at maximum depth. The increasing irradiance after 12:00 UTC caused a rapid increase in surface temperature from 16.4 oC to 16.8 oC at 13:15 UTC. During this increase the heat was dissipated vertically causing slight stratification with a difference of 0.6 oC between the surface and maximum depth (2m). As the tide ebbs the warm, less saline river water increases the surface temperature. At 13:30 UTC the surface temperature reached 17 oC, with temperatures of 16.6 oC at depths up to ~1.6m. The slack water at ~13:44 UTC allowed heat to dissipate further down the shallow water column. As the tide began to flood, the denser, colder more saline water undercut the warm, less saline surface waters. Between 14:00UTC – 15:00UTC a clear stratification was recorded with a maximum surface temperature of 17 oC and minimum temperature of 16 oC at 3.5m, indicative of a temperature gradient throughout the water column.
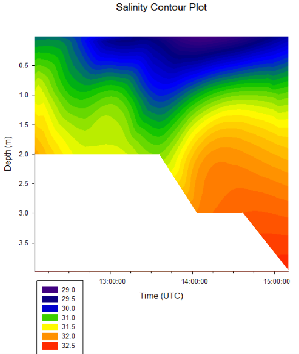
Up to 13:00 UTC there is weak salinity stratification, this is at the latter part of the ebbing tide and so warm, less saline river water decreases the surface salinity. This movement of less saline water causes the first 2m to decrease in salinity until ~13:44 UTC which is low tide. As the tide begins to flood denser, cooler, more saline water moves up the river increasing the salinity between ~1.2m and the riverbed. Between 14:30 UTC and 15:00 UTC the water column is most stratified displaying a salinity of 29.5 at the surface and 32.5 at 3.5m depth.
On the day, a high water of 4.8 m was estimated at 7:19 UTC and a Low tide of 0.8 m was estimated at 13:44 UTC.
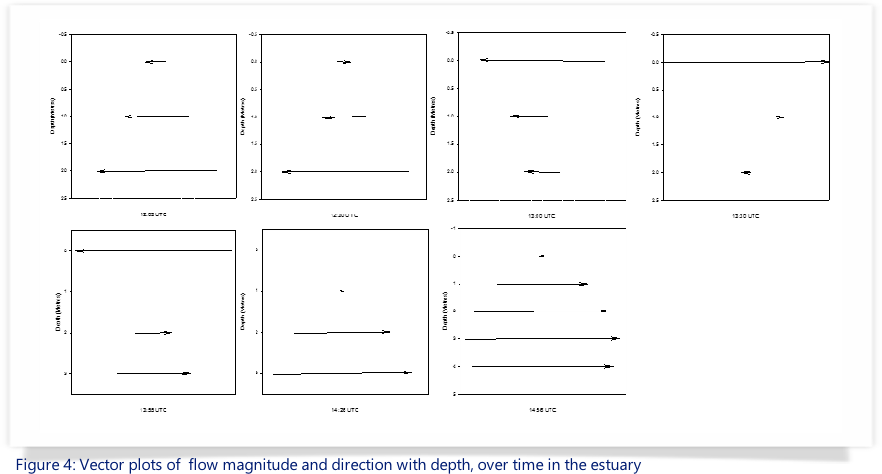
Flow speed and direction changed with time and depth: they were represented by the arrows on the figures. From 12:03- 12:33, although the flow speeds stayed the same, and increased with depth, the weak surface flow direction reverses. This could be attributed to the weather (strong wind and rain) or could even be due to the wake of a nearby boat. From 12:30 to 13:00, the flow magnitudes change: they decrease with depth. There is an anomaly at 14:00 UTC, showing a strong surface current going in the reverse direction than would be expecting with the incoming tide. This was due to a Ferry leaving our pontoon station at 14:02. Furthermore, a wash on was observed at 13:59.
The overall pattern shows an increase in tidal speed. From 13:00 to 13:55 UTC, the surface flow increases dramatically from 0.048 to 0.126, due to the flooding of the tide (low tide was measured at 13:44 UTC). This was then followed by negligible surface flow speeds of 0.014 and 0.001, and an overall trend through the water column of an increase with depth.
At 1 m depth (intermediate at our pontoon station), the direction of the current is in concordance with the incoming tide, as is its magnitude (increasing from the change in direction from 13:30 to 14:47 UTC. Slack tide was observed at 1 m at 13:55 with a flow of 0 m/s and 14:26 with a flow of 0.02 m/s.
At 2 m, the flow magnitude decreased from 12:00 reaching an almost negligible value of 0.005 m/s at 13:30, at which point, it began to increase again, accompanying the reverse in direction.
Although some fluctuations or anomalies were observed, the overall pattern showed an increase in flow speed after a slight decrease from 12:00 to 15:00, accompanying the upcoming transition from low to high tide.