
The aim was to investigate how the nitrate, phosphate, silicate, oxygen and chlorophyll concentration changed horizontally from the top of the estuary to the mouth, and vertically at each station.
A CTD with 6 Niskin bottles was deployed at each station collecting water samples at depth, mid water and at the surface. Two bottles were fired at each depth. The water samples were then transferred to numbered bottles or filtered and then transferred to bottles.
A lab procedure was followed in order to determine the concentration of nitrate, phosphate, silicate, oxygen and chlorophyll using the following standard methods:
- Manual chlorophyll, dissolved phosphate and silicon (Parsons et al., 1984) [15]
- Dissolved oxygen (Grasshof et al., 1999) [14]
- Nitrate by flow injection analysis (Johnson et al., 1984) [13]
A Secchi disk was also deployed at each station to determine he water clarity of the estuary.
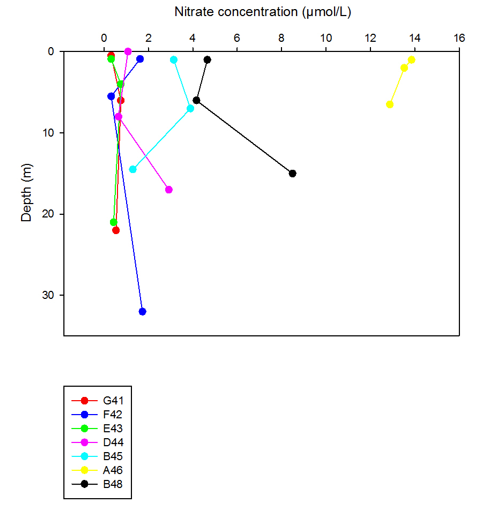
Nitrate
The nitrate concentration (µmol/L) increased with depth at all stations except for station A46 and B45 were it decreased. Station A46 at the top of the estuary had the highest concentration of nitrate, while the stations closer to the mouth of the estuary showed lower concentrations. This could be due to the stations near the mouth of the estuary being more influenced by the movement of the tide and mixing of the water column than the stations higher up the estuary.
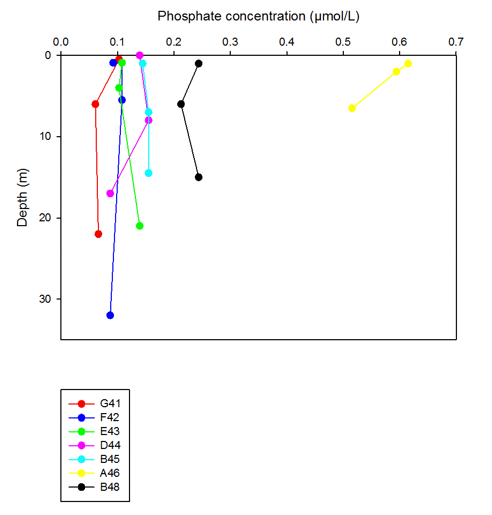
Phosphate
The phosphate concentration (µmol/L) decreased with depth at station A46, D44, B45 and G41, and increased with with depth at station B48, E43 and F42. The highest concentration of phosphate was found at station A46, and the lowest at the stations near the mouth of the estuary. The biggest difference in concentration through the water column was at station A46 at the top of the estuary, while the stations near the mouth at the estuary showed mixed trends.
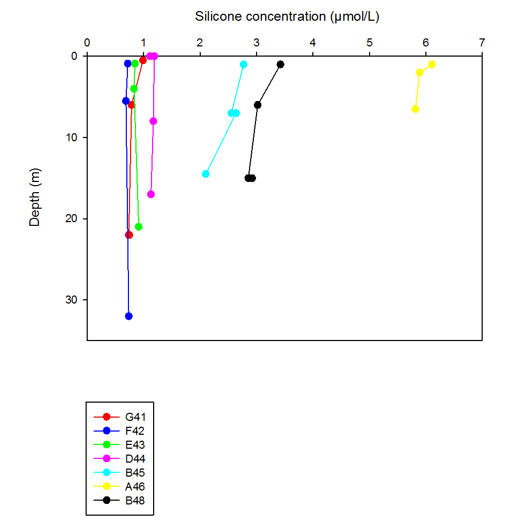
Silicon
The silicon concentration (µmol/L) decreased with depth at all stations except for station E43 were it showed a slight increase at 21 metres. station A46 had the highest concentrations of silicon, and station F42 the lowest.
The surface samples showed the highest concentrations for the stations higher up the estuary, while the samples collected at the stations near the mouth of the estuary showed lower concentrations of silicon. The samples taken at the stations near the mouth of the estuary showed a bigger difference in concentration through the water column than the samples taken higher up the estuary. This could be a result of the tide influencing the mixing of the water column near the mouth of the estuary, while not having as much of an effect on the water column higher up the estuary.
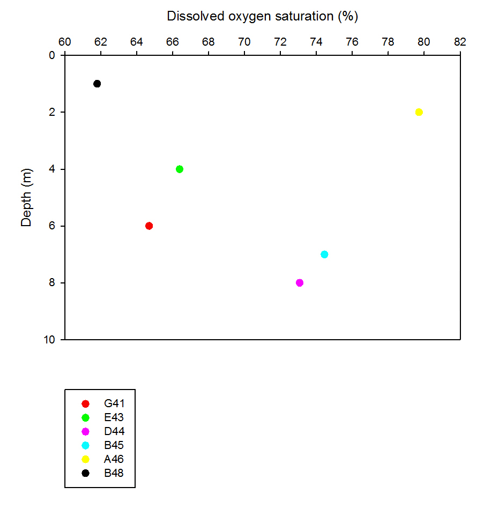
Dissolved Oxygen
The dissolved oxygen saturation (%) of the surface water (samples taken at station B48 and A46) was higher at station A46 at the top of the estuary than at station B48 further down the estuary. The dissolved oxygen saturation of the bottom water (samples taken at station G41, D44 and B45) was higher at station B45 and D44 than at station G41 at the mouth of the estuary.
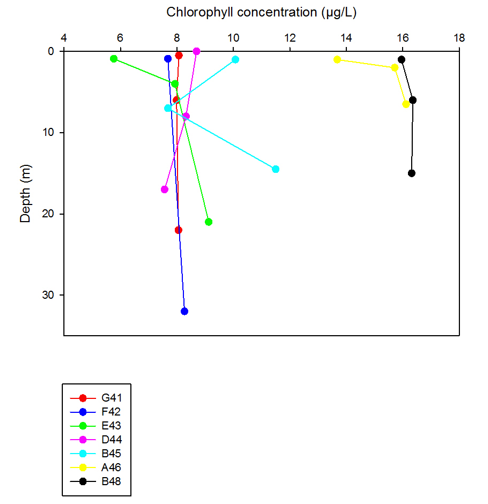
Chlorophyll
The chlorophyll concentration (μg/L) of the surface water showed the highest concentration at station B48 at the top of the estuary and the lowest at station E43. The chlorophyll concentration increased with depth at all stations except for station D44 and G41 where it slightly decreased with depth. The variation in concentration in the estuary could be a result of different species of plankton preferring different areas of the estuary depending on the salinity and nutrient availability.
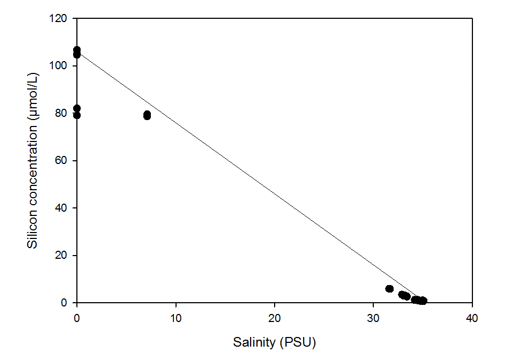
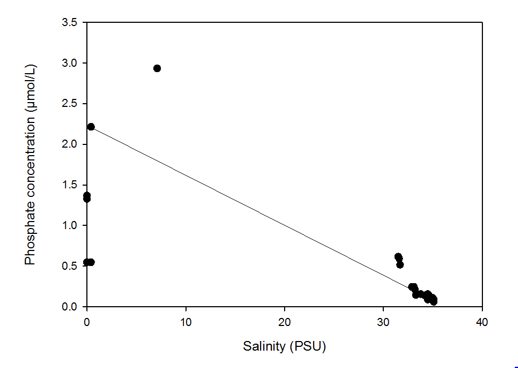
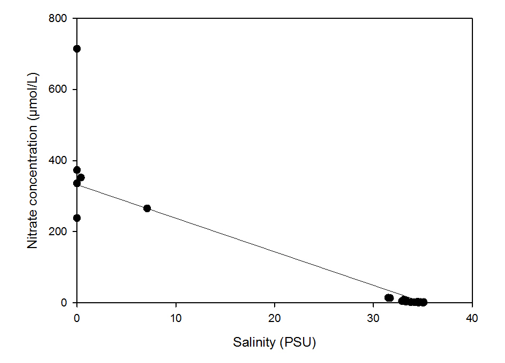
Estuarine mixing diagrams
The estuarine mixing diagram for nitrate and silicon showed a non-conservative behaviour with a removal of nitrate and silicon when looking at the theoretical dilution line. For phosphate however, non-conservative behaviour was also observed, but there was an addition of nutrients.
This could be explained by nitrate and silicon being taken up and used by phytoplankton, while the addition of phosphate could be a result of phosphate being added to the estuary as runoff from sewage and agriculture.
The data collected was taken at stations of salinities between 30 and 35 PSU, and not further up the estuary at lower salinities, it was therefore not possible to draw any conclusions about the behaviour of the rest of the estuary.