
The aim was to measure how nitrate, phosphate, silicate, oxygen and chlorophyll change with depth at three stations offshore of Falmouth, Cornwall.
Methods
Water samples were collected from Niskin bottles to measure the nitrate, phosphate, silicate, oxygen and chlorophyll samples at the different depths. Concentrations were determined using the following standard methods:
Manual chlorophyll, dissolved Phosphate and Silicon:
As done by Parsons et al., 1984 [15]
Dissolved oxygen
As done by Grasshof et al., 1999[14]
Nitrate by Flow injection analysis
As done by Johnson et al., 1984 [13]
Silicon:
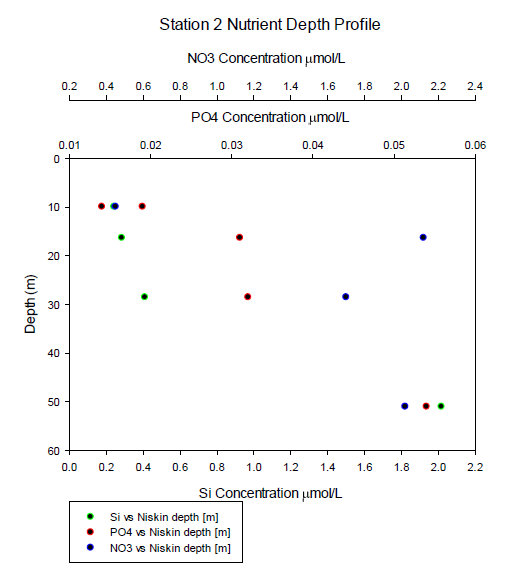
At station 2, the silicon concentration increased gradually with depth, from just over 0.2 µmol/L to just over 0.4 µmol at almost 30 metres (figure 1). Silicon then rapidly increased to just over 2.0 µmol/L at around 50 metres (figure 1).
The decreasing silicon concentration with depth may be due to the presence of diatoms, which utilise silicates in their frustules.
Phosphate:
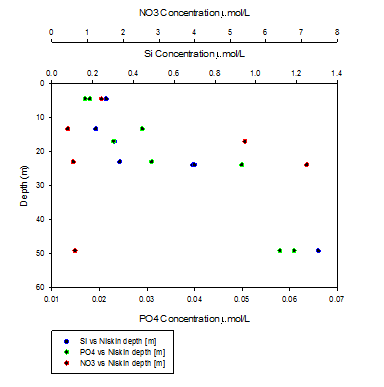
The phosphate concentration increased from a mean value of 0.017 µmol/L at 9.9 metres to 0.31 µmol/L at 16.3 metres, followed by an almost negligible increase to 0.032 µmol/L at 28.5 metres (figure 1). Phosphate then rapidly increased to almost 2.0 µmol/L at 51.0 metres (figure 1). At station 3 phosphate generally increased from a mean of 0.018 µmol/L at 4.7 metres to 0.060 µmol/L at 49.2 metres, with a significant increase from 0.031 µmol/L at 23.1 metres to 0.05 µmol/L at 24.0 metres (figure 2). Phosphate concentrations remain high at station 2, and further increases at station 3.
Nitrate:
Nitrate exhibited a sharp increase 2 µmol/L at 16.3 metres from 0.45 µmol/L at 9.9 metres (figure 1). Nitrate then gradually decreased to 1.7 µmol/L at 28.5 metres, before returning to a higher value of 2.02 µmol/L at 51.0 metres (figure 1). Nitrate exhibited no general trend with depth, but was found to be greatest at 24 metres, where the concentration reached 7.15 µmol/L. Nitrate concentrations are also higher at station 2 than station 3.
Chlorophyll:
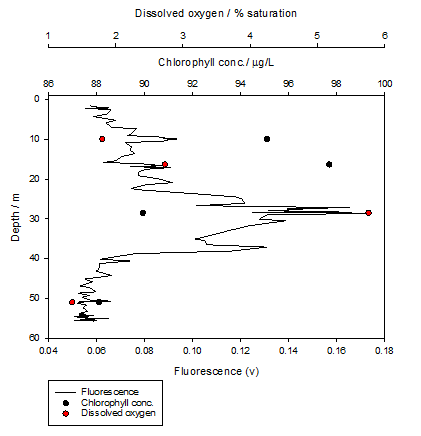
Chlorophyll concentration (according to fluorescence) was highest at the thermocline, at 28 m. This corresponded to the highest concentration of dissolved oxygen (figure 3).
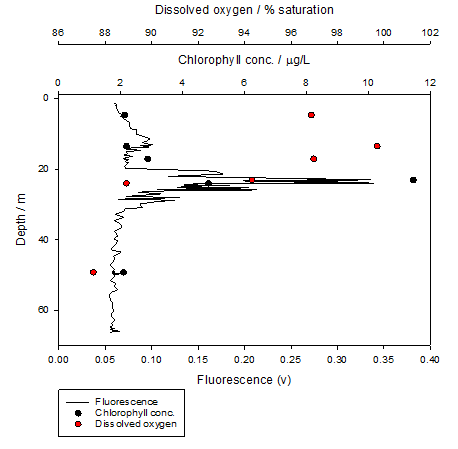
Fluorescence values for stations 2 and 3 show that phytoplankton concentration is maximum below the thermocline, at the base of the euphotic zone. Chlorophyll concentrations peaked at 24 m in figure 4. Chlorophyll concentrations matched up very closely with fluorescence values at station 3, however at station 2 this was not the case, as there was no correlation with phytoplankton at the highest chlorophyll concentrations (figure 4). This could be due to poor calibration of the fluorometer, or due to experimental error when determining chlorophyll concentration. The maximum chlorophyll concentration from the depletion of nutrients in surface waters, in turn causing phytoplankton to sink and exploit the nutrient rich water at the base of the euphotic zone [16].
Dissolved Oxygen:
Dissolved oxygen was highest at the thermocline, reaching over 5% (figure 3). This thermocline was at 28.5 metres, and coincided with peak chlorophyll.
Dissolved oxygen was recorded highest at 16.3 metres, the thermocline (figure 4).
One replicate was taken for station 2, with differences of 0.005 between the two replicates this indicates that there was low reliability and accuracy. Conversely, the two replicates from station 3 indicated high reliability and accuracy, with differences no greater than 0.003.