
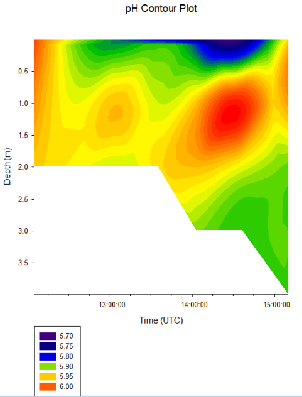
Due to problems with the calibrations of the Exoprobe, the pH measurements were much too acidic. So instead of analysing the values, there was a focus on the variations.
The pH variations coincided with that of the dissolved oxygen % variations. This was due to pH values decreasing with influxes of saline seawater and the respective outgoing/incoming tide. From 12:05 to 12:25, between the surface and 2 m (max depth) at low tide, the surface pH was at its highest with values varying from 5.95 to 6. Then from 13:00 to 14:55 UTC between 0 and 0.4 m depth, the pH reached its lowest values, with measurements between 5.8 and 5.75. The pH increased due to the ebb tide. From 14:00 to 14:45, between 0.5 and 2 m depth, the pH increased back to 6, showing a direct correlation with the increase in oxygen saturation.
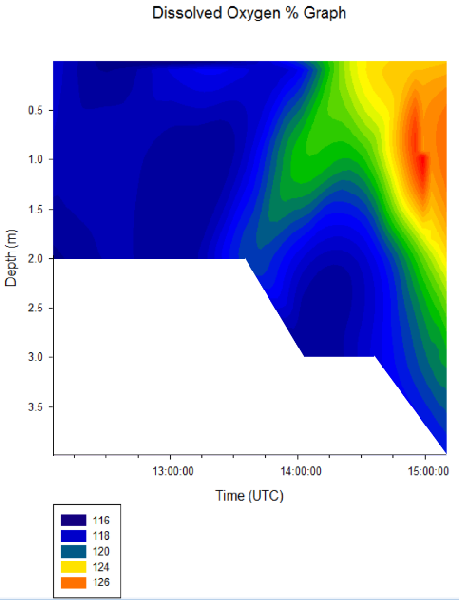
From 12:05 to 13:30, there is little to no variation in dissolved oxygen, with measurements between 116% and 118% in Saturation. After 13:30, the waters become more visibly stratified.
Overall, the oxygen saturation is higher in surface waters, especially from 13:30 UTC to 15:10 UTC and at 14:45 UTC it peaks to 130% at 1.1 m depth. After low tide at 13:25, the dissolved oxygen increased by up to 12 %, from 116% at 0.6 m depth at 12:10 UTC to 128% at 1.1 m depth: the deeper saline oxygen rich water sits on top of the oxygen rich riverine waters. Overall the tidal input caused the dissolved oxygen to increase throughout the day. Riverine (pontoon) waters are low in dissolved oxygen in correlation with the high nutrient concentrations and higher bacterial activity which depletes the water column of oxygen due to respiration.
NB: The chlorophyll measurements were obtained through the analysis of Niskin bottle samples and could not be used to represent the biomass. They are not indicative of the water column: chlorophyll must be measured using fluorometry.