
The aim of sampling the three offshore stations was to study the spatial change in stratification between locations as a result of changes in physical characteristics of the water column, and the effect on biological and chemical parameters.
A CTD rosette with Niskin bottles attached was deployed to sample the water column, and measure the temperature, fluorescence, light transmission and conductivity, from which salinity was calculated. Water from the Niskin bottles were bottled for later analysis of nutrients (Si, PO4, NO3) and chlorophyll concentration. The Mini-BAT supported a CTD that was towed behind the boat, undulating between depths of 5 to 40 metres. The flow was measured using an Acoustic Doppler Current Profiler (ADCP) on the underside of Callista, then analysed using WinRiver software.
Station 1: Well Mixed
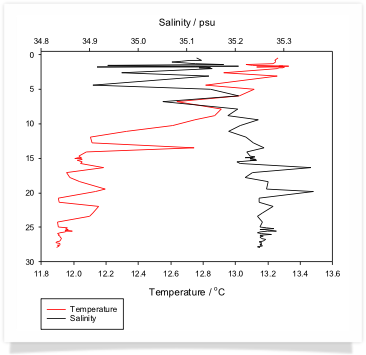
Due to its position within the tidal mixing zone, Station 1 was expected to have a well-mixed water column. There was large temperature fluctuation across the water column (Fig.1), decreasing by two degrees between the surface and deepest measurement of 28 metres, and salinity increased by one unit overall, down the water column, suggesting that there was mixing and no stratification.
Station 2: Stratified
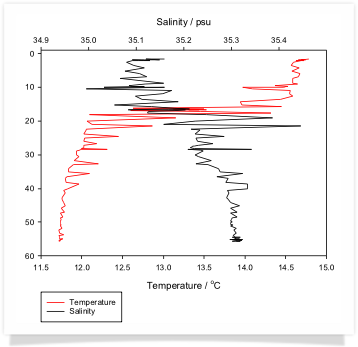
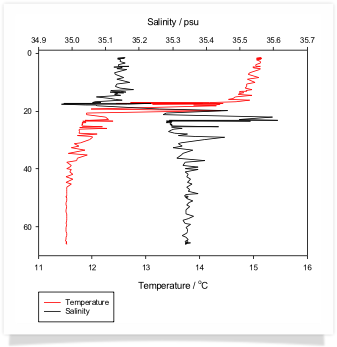
Station 2 was positioned offshore in waters that were expected to be stratified, but still within influence of coastal processes. The salinity increased gradually with depth, but a sudden change in temperature at 20 metres created a thermocline (Fig.2).
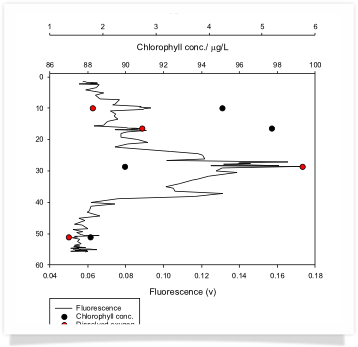
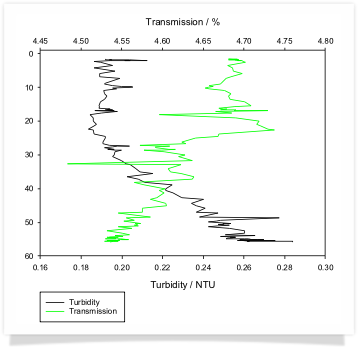
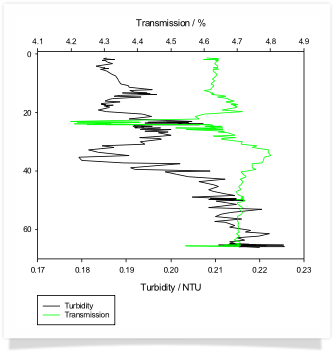
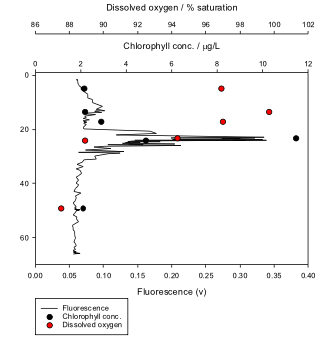
Fluorescence peaked at 30 metres depth below the thermocline at 20 metres (Fig.3), and correlates with a low percentage saturation of dissolved oxygen, while in the overlying water that was sampled, there was a higher dissolved oxygen concentration. Light transmission decreased with depth while turbidity increased (Fig.4).
Station 3: Stratified
The similar location of Station 3 to Station 2 meant the same stratification was expected, but the depths the different layers of water could be at was expected to be different.
There is a pronounced halo and thermocline at 20 metres depth (Fig.5), where there is also a peak in fluorescence (Fig.6). The fluorescence spike correlates with the decrease in light transmission at that depth (Fig.7), and it can be assumed that this is not due to increasing turbidity as there is no sudden, large increase in the depth profile of turbidity.
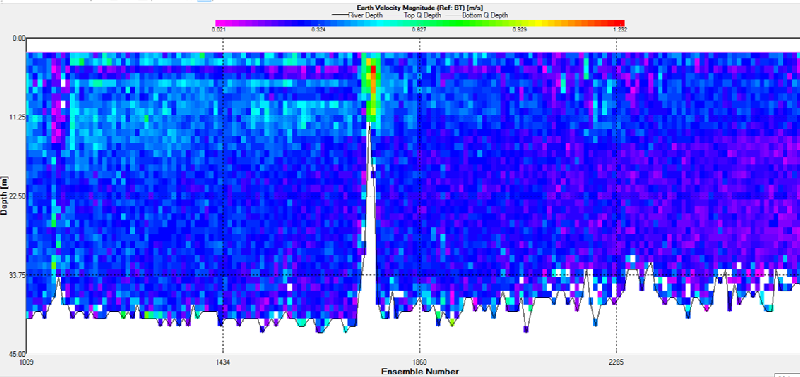
ADCP Flow:
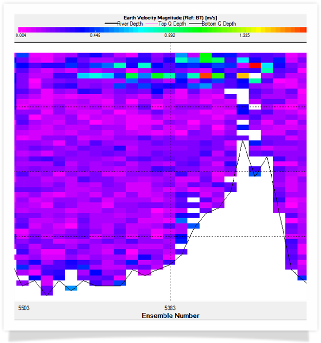
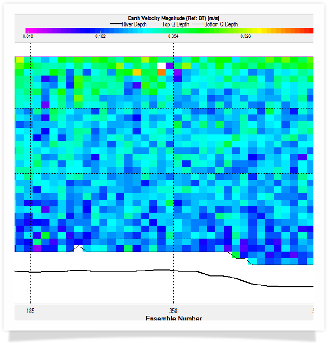
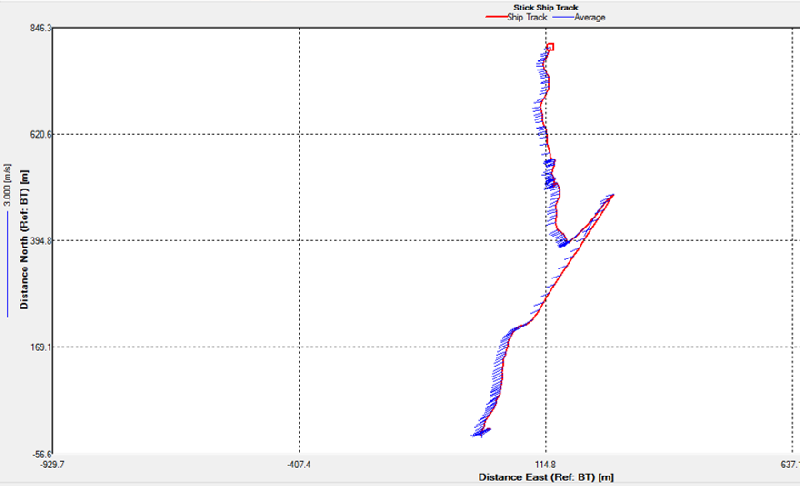
The ADCP was switched on between stations to create transects of flow and while on station to make a time series. However, due to rough weather during data collection the crew were impaired from reliably collecting the ADCP data. In general, the flow was fastest at the surface and slower deeper in the water column (Fig.8). At stations 2 and 3 where the water column was deeper, the flow was slower (Figs.9&10). However, faster currents were measured and this could have been due to going back on the ship’s track and measuring the flow created by the boat (Fig.9). As these two stations were located offshore outside of coastal influence, it was expected that the water column would not be affected by tidal currents while Station 1 shows a faster flow. Station 1 was located within coastal influence and measured an hour before Low Water. The flow direction was 228.41˚ heading to the South West out of the Fal Estuary, so the currents at Station 1 were under the influence of the ebbing tide when it was measured.