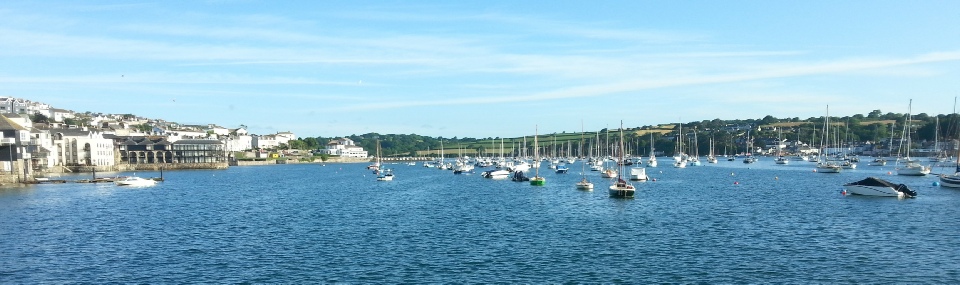

The aim of the practical was to examine the spatial and temporal changes in the physical properties of the Fal Estuary, specifically temperature, salinity, fluorescence, transmission and flow, allowing for future analyses of the mixing processes in the estuary, which are influenced by the system of rivers and stream interacting with the ocean through tidal mixing.
A CTD was deployed to acquire depth profiles and samples for nutrients and phytoplankton. Flow was measured through use of an ADCP bolted to the side of the vessel. A secchi was deployed once per station (A47 and B45 for the once that were sampled twice).
Tidal Flushing
The time needed for the freshwater in the estuary to be completely replaced due to tidal flushing can only vaguely be estimated, as the area of the estuary and volume of the water cannot be exactly determined due the complexity of the riverine feeding system.
The estuary is characterised by its meso-tidal range of around 2.5m.
Ve = Volume of estuary [m3]
Vp = Volume of tidal prism (area*tidal range) [m3]
Tp = Tidal period; here M2 tide so 12.42 hrs
The flushing time depends on the volume of the estuary, which in this case is relatively large, over the volume of the tidal prism, which due to the low tidal range will be relatively small. This results in slow tidal flushing.
For every CTD deployment, an ADCP time series was created; none of which showed changes in flow speed over the duration of the CTD operation that could have had effects on the results.
Various transects across the estuary at Stations A47, B45, D44 and E43, show increased flow speed at the surface with an overall water movement out of the estuary. Flow speeds were generally higher in the centre of the channel. Near Low water at A47, total water flow was 161 m3/s which is due to input from the River Truro.
The transect at G41 had a larger total flow out of the estuary (1190 m3/s) compared to the transect at F42 (481 m3/s), as the Penryn and Percuil rivers feed into the estuary.
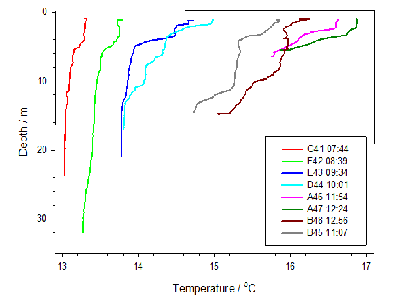
Stations near the mouth of the estuary (G41 & F42) show a constant high transmission value and corresponding low fluorescence through the water column, indicating a lack of suspended material (biomass or sediments), which allows for a high Secchi depth.
Proportional to the distance from the estuary mouth, transmission decreases for each station, as fluorescence increases, showing peaks at about 5m depth. Decreasing Secchi depth measurements confirm the increase in suspended matter.
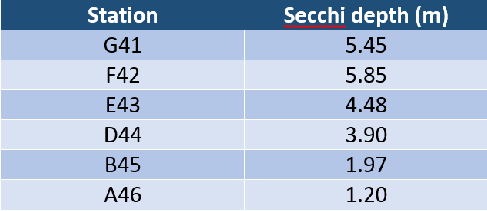
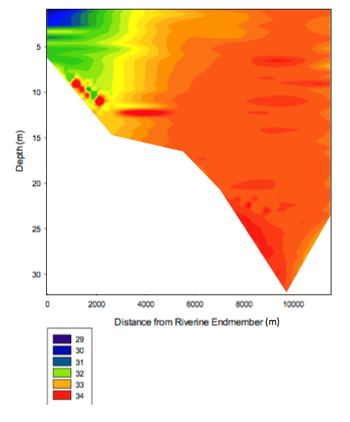
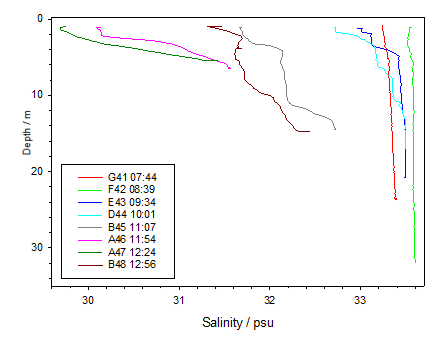
Figure 1 shows fresh water coming into estuary from riverine end and mixing occurring at the surface with a salt wedge present from the mouth of the estuary. This represents the the ebbing tide which promotes fresh water replacing salt water