
The aim of this survey was to analyse the abundance and distribution of phytoplankton and zooplankton species at 3 stations offshore of Falmouth.
Phytoplankton samples were collected at all stations (table 2), with 1 sample collected at station 1, 3 at station 2 and 6 at station 3. Phytoplankton samples were collected using 100ml of water from the Niskin bottles, added to brown bottles containing 1ml of Lugols. One ml of sample was placed in a Sedgewick Rafter counting chamber and a tenth of the sample was counted. This was then used to calculate cells per millilitre.
Zooplankton samples were collected only at station 2 (table 1) using a zooplankton net with a mesh size of 200µm and a diameter of 0.5 metres. The net was deployed to 28 metres, then raised and closed at 25 metres, collecting 1 litre of water in total. This corresponded with the fluorescence maximum at about 28 metres, below the thermocline. Zooplankton were counted in the lab in 10ml of water in a Bogorov counting chamber. This could then be used to calculate the number of each of the zooplankton species per m3.
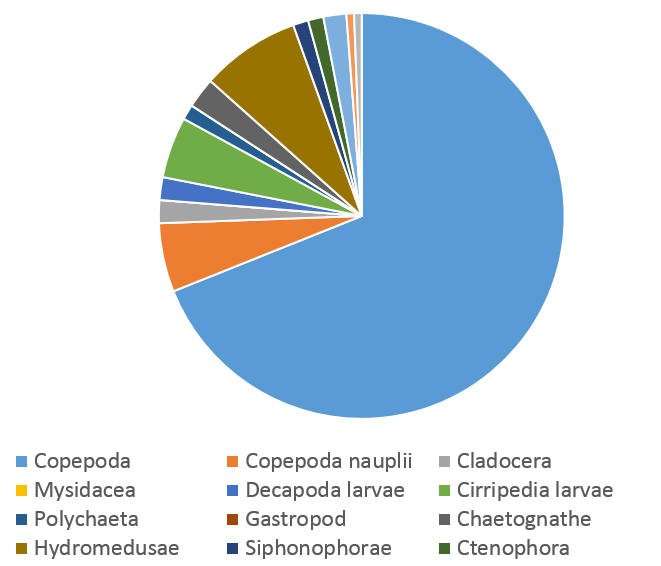
Zooplankton species were clearly dominated by copepod sp., composing 68.94% of the population between 25 and 28 metres at station 2 (figure 1, table 1). Hydromedusae sp., copepod nauplii sp. and cirripede larvae sp. were also found in notable abundance, together making up 18.29% of zooplankton species (figure 1). Numerous other species were found in low abundances (figure 1, table 1). Zooplankton taken at station 2 show that not only a wide number of species were present, but that copepoda was the dominant species. This dominance is expected in marine food webs [21]. Taking samples at different depths and stations would have allowed comparison of composition and abundance of different zooplankton species over spatial scales.
Phytoplankton count was low at station 1, where only 190 cells were counted per ml at the 15.3 metres where the Niskin bottle was taken. This low phytoplankton count coincided with a peak in fluorescence at around 15 metres (table 2).
At station 2 phytoplankton cell count increased with depth, from 920 cells per ml at 9.9 metres to 6320 cells per ml at 28.5 metres (table 2). The significantly high phytoplankton cell count at 28.5 metres was taken just over 10 metres below the thermocline (table 2). Furthermore, the sample from 16.3m was taken on the thermocline (table 2), giving a high phytoplankton cell count of 1590 cells per ml.
Phytoplankton cell count was marginally highest at 17.1m, the thermocline, at station 3 (table 2). Comparatively high values were recorded just below the thermocline, at 23.1m and 24.0m, and in surface waters at 4.7m (table 2). Cell count was lowest at 13.5m and 49.2m (table 2). Overall, station 1 clearly lacks enough data to give an analysis of the abundance and distribution of phytoplankton with respect to the water column. However, we can use our data to get an idea at stations 1 and 2. Station 2 had the greatest phytoplankton cell count below the thermocline, and therefore may possibly be the location of the deep chlorophyll maximum (table 2), commonly observed below the thermocline [22]. Station 3 lacked the prominent increase in phytoplankton cells below the thermocline, with phytoplankton cell counts not differing much between samples taken just below and at the thermocline (table 2). This spatial variability in phytoplankton cell counts could be owed to numerous factors, such as wind stress [23].
Furthermore, human error during the counting and insufficient mixing of samples in the bottle could have lead to anomalies in the data set.
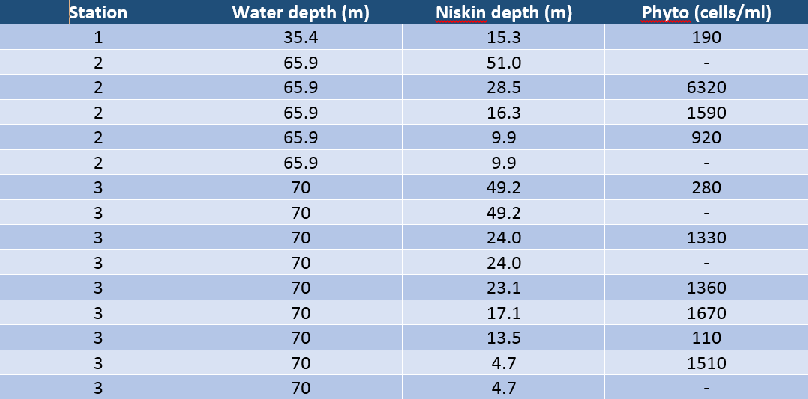
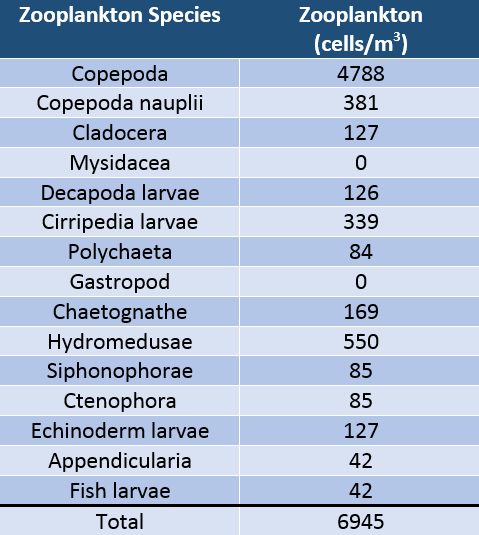
Table 2: Number of each zooplankton species collected at station 2 (50o 05.604 N, 4o 52.007 W) on 20/06/2016 using a zooplankton net with a 200 micron mesh and 0.5m diameter lowered to 28.0m, and closed at 25.0m.
20/06/2016 using Niskin bottles deployed to a range of depths.