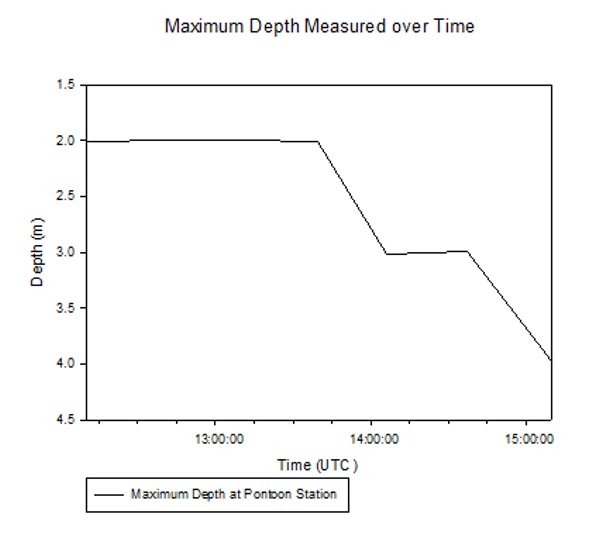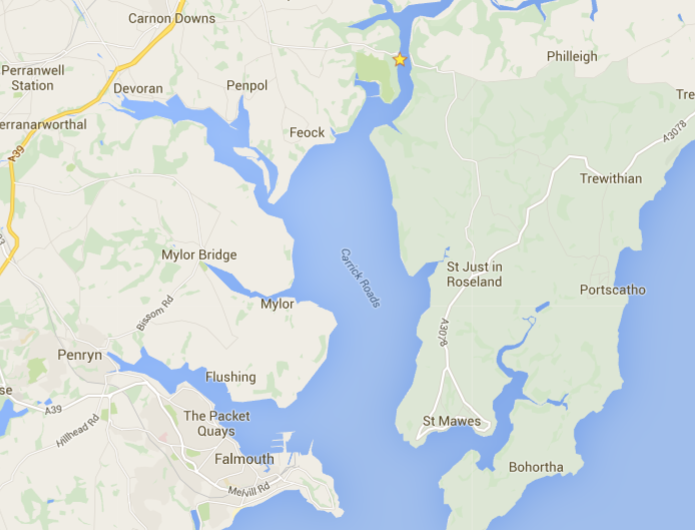

On the 22nd June 2016 measurements were taken from the pontoon near King Harry Ferry at 50°12’58.0’’N, 5°01’39.5’’W from 12:03 UTC to 15:10 UTC. The high tides were at 07:19 and 19:31 and low tides at 01:27 and 13:44 (tidetimes.org.uk).
Measurements were taken at the same position every 30 minutes at surface and 1 metre intervals using:
- Exoprobe to measure temperature (C°), salinity (psu), dissolved oxygen (% saturation and mg/L), pH and depth (metres).
- Light probe to measure the light irradiance above water, at surface and at 1 metre intervals below water.
- Niskin bottles to collect water samples which later were analysed in the lab to find the chlorophyll concentration.
- Flow meter to measure the flow speed and direction.
Taking vertical measurements from a stationary point enabled us to investigate the physical, chemical and biological changes in the Fal estuary through the tidal cycle allowing us to see how the different parameters changed through the water column.
We expected to see a change in salinity and temperature as the tide changed from low to high as the more saline and colder water moved into the estuary increasing the salinity and decreasing the temperature. The flow speed was predicted to increase during the influx of water and to decrease during slack water. The chlorophyll concentration was expected to increase as the water moved into the estuary.
A ferry passed the pontoon at 11:50, 12:50, 14:05 and 15:15 UTC.