
The views and opinions expressed are solely those of the contributors, and do not necessarily reflect those of the University of Southampton or the National Oceanography Centre Southampton.
Falmouth 2015 - Group 7

Pontoon
Results
Chlorophyll:
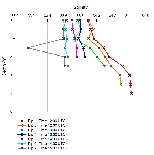
Figure 7a shows chlorophyll values calculated from filtered samples and fluorometer readings as well as data from the sondemeter. The filtered samples taken from the surface showed an increase in chlorophyll concentration over time as the tide was going out. For example at 12:00 UTC, the average calculated chlorophyll value was 0.097 µgl-1, whereas by the end of the sampling time (15:00 UTC) the average value was 6.492 µgl-1, therefore showing a marked increase of 6.395 µgl-1. The YSI probe, however, shows much more variable results due to a lower degree of accuracy than the extraction method. Despite these variations, the YSI data also shows higher concentrations of chlorophyll towards the surface as the tide recedes. Chlorophyll is shown by the majority of samples to increase in abundance with depth- all samples except dip 7 follow this trend. Until 1 meter the first 6 dips all increase steadily, however, after 1 meter the samples begin to express more variation in chlorophyll levels. for example, dips 1 and 3 reach 8ug at 2m whereas dip 4 only reachs 4ug.
Dissolved Oxygen:
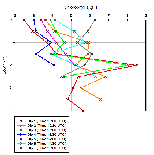
Dissolved oxygen was measured along a depth profile taken by a Sonde meter. Figure 7c shows an increase in dissolved oxygen over time as a percentage saturation, but a relatively stable over depth, with samples at 12:00, 12:30, 13:00, 14:00 and 15:00 UTC showing overall drops in dissolved oxygen between the surface and maximum depth at the time. An example of this change can be seen at 12:00 UTC, which exhibits a decrease of 5.2% between the surface and a depth of 4m. The 14:30 profile is the only exception to the observed trend in dissolved oxygen increase over time as it shows a higher saturation than the 15:00 profile.
Salinity:
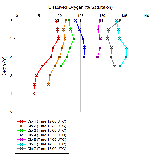
Salinity was also measured by the Sonde meter, profiles are shown in figure y. The figure 7d exhibits an expected increase in salinity with depth throughout the period sampled. Despite showing similar patterns, overall salinity is lower as time goes on (as tide goes out), for example, at 12:00 (UTC) salinity at the surface is 33.9, at 4m it is 34.4. By 14:30 surface salinity decreased by 0.31, showing a greater inflow of freshwater. Another notable observation is a considerable drop in salinity in the 15:00 profile at the mid-water column of 0.44, this then returns to previous levels at greater depths.
Temperature:
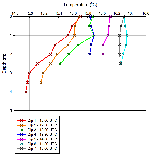
Temperature, measured by the Sonde meter, also shows an expected trend of decrease in temperature with depth; for example at 12:00 (UTC) the surface temperature was 15.7ºC, which decreased to 14.95ºC at the maximum depth of 4m showing an overall decrease of 0.75ºC throughout the water column. Overall temperature in the water column also increases over time, from 15.7ºC at the surface at 12:00 (UTC) to 16.30ºC at 15:00 (UTC). These results are shown in figure 7e
Turbidity:
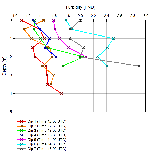
Turbidity was measured by the Sonde meter, and displayed in figure 7f. It shows a lot of variance but there is a general trend where turbidity increases with depth, for example, at 15:00 (UTC) the surface turbidity was 1.59 (FNU) and at 2m depth, the turbidity was 2.09 (FNU). The turbidity also shows a trend of increasing over time. The turbidity at the surface at 13:00 (UTC) was 1.10 (FNU) which increases to 2.00 (FNU) at 16:00 (UTC).
Irradiance:
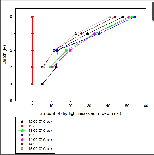
The light meter shows a decrease from dry light at 110% to an average 50% as soon as the sensor enters the water- wet light. From surface to depth a general trend is seen across all stations, the light received decreases to 5-10% of the available surface light by the maximum depths recorded. The small variation seen can be attributed to variation in cloud cover and angle of incidence of the light itself. The measurement at 12:30 is considered an anomaly and was due to human error in using the equipment.
Methodology
| Background |
| The Group |
| Methodology |
| Physical |
| Biological |
| Chemical |
| Methodology |
| Physical |
| Biological |
| Chemical |
| Methodolgy |
| Results |
