
The views and opinions expressed are solely those of the contributors, and do not necessarily reflect those of the University of Southampton or the National Oceanography Centre Southampton.
Falmouth 2015 - Group 7
Phytoplankton
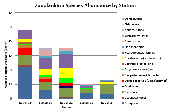
Phytoplankton abundance was recorded at each station, and a count of different species was also recorded at different depths within the station. At station 19 phytoplankton levels and species found were recorded at 9.2m, 21.3m and 31.2m. At a depth of 9.2m there was 160 per 1ml, made primarily of Odontella sinensis. As seen in figure 2a at 21.3 and 31.2m this changes dramatically with 1050 and 640 organisms being recorded per ml respectively. The abundance of species present also shifted with depth, at the middle depth Ceratium fusus is the most common species- as is a common theme throughout depths between 20 and 40 meters. Stations 20 and 21 both exhibit low counts of phytoplankton across all depths, the greater depths in both cases displaying the greatest phytoplankton count, about 400 per ml. Stations 22 to 24 reveal the same trend; the amount of phytoplankton increases with depth to about 35m after which the levels begin to fall. This is likely primarily due to the depth to which light is able to penetrate the water, when recorded via secchi disk and then calculated this was found to be 33.6m offshore during the data collection.
Zooplankton
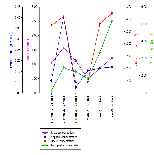
Station 19 recorded the greatest volume of zooplankton of any of the sites. Figure 2b shows that of the 48 individuals recorded at site 19 per m3, almost half (22) were Copepoda, the other key species at this site were Cladocera, Decapoda larvae and Hydromedusae. Station 20 shows a drop in species volume but an increase in diversity. The number of species recorded was 36 per m3, with the most abundant species being Copepoda, Hydromedusae and Cladocera with a total of 18 specimens between the three species. Similarly station 22 had 35 individual organisms per m3, with a variety of 11 species. Chaetognatha, Hydromedusae and Cladocera were the most common organisms at station 22. Station 23 and 24 differed from the first three stations as they had much lower capture rates in terms of both species and number of organisms. Station 23 held only 10 individuals per m3, of 6 species and station 24 produced 12 species also of 6 species. All stations started with similar concentrations of chlorophyll at 10m depth, within ±0.1 of 0.5μmol/L, and experienced an increase with depth. The maximum chlorophyll occurred at 30m with the majority of stations reading 2 to 4 μmol/L, after which point the concentrations decreased back towards original low levels. At station 24 there was a chlorophyll peak at above 5μg/L suggesting that we had come across the previously observed chlorophyll bloom.
Redfield Ratio
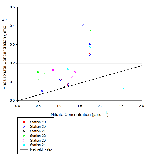
The molecular composition of phytoplankton approximately follows the Redfield ratio (16:1 - nitrogen: phosphate)(17), so figure 2d shows this. The stations 21 and 22 in figure 2c are lower in silicon, so could be stations where silicate is limiting, especially as chlorophyll levels do not decrease. All points on figure 2d except 12.4m at station 24 are above the ratio line, indicating that nitrate is the limiting nutrient. At this point, the result is an outlier so can be discarded. The rest will be further investigated by incorporating irradiance and mixing factors. When nitrate is limiting, growth is slowed greatly as transcription cannot occur.
Fluorescence
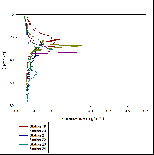
Fluorescence was also measured (figure 2e). The aim of collecting this data was to locate and analyse the properties of the phytoplankton bloom, therefore a peak in fluorescence would likely indicate the presence and strength of a bloom and was used to determine which sites to sample using the CTD profiles. All stations exhibited an increase in fluorescence levels corresponding to the depth thermocline, however there was large variation in fluorescence levels depending on station, for example station 24 exhibited the largest peak in fluorescence indicating the largest bloom, whereas station 21 showed a very mild increase in fluorescence.

Phytoplankton and Zooplankton - Initial Biological Findings
Methodology
Physical
Chemical
| Background |
| The Group |
| Methodology |
| Physical |
| Biological |
| Chemical |
| Methodology |
| Physical |
| Biological |
| Chemical |
| Methodolgy |
| Results |


