
The views and opinions expressed are solely those of the contributors, and do not necessarily reflect those of the University of Southampton or the National Oceanography Centre Southampton.
Falmouth 2015 - Group 7
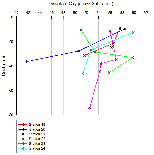
Dissolved oxygen, shown on figure 3a to the left (rollover to enlarge with legend), generally showed a decrease in saturation with depth. This was constant in all stations, except for station 22 which increased from 51% at 10 meters and continued to increase to 60% at 32m, before falling back to 56%. Other stations recorded dissolved oxygen saturation levels of around 58% at 10m and fell at variable levels, the most extreme of which being station 20 which fell to 42% by 35m.
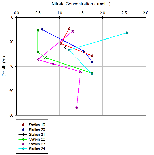
Nitrate levels are variable with no clear trend, shown on figure 3b. Stations 19, 23 and 24 show initial decreases followed by increases as depth increases. In contrast stations 20 and 22 show an increase with depth. The highest nitrate levels were recorded at station 24 at 10m and gave readings of 2.6 μmol/L where as lowest concentrations were present at stations 23 and 22 where the concentration was 0.5 μmol/L.
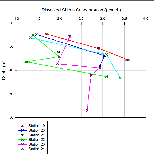
Dissolved silicon concentrations in figure 3c increased with depth. Stations 19, 20 and 24 increased from 1.5 μmol/L to 3 to 3.5 μmol/L at 20 meters, whereas stations 22 and 23 initially decreased but then increased at 30m from the starting concentration of 1.4 and 2.3 respectively to 3 μmol/L.
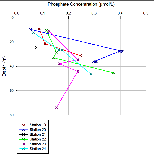
Phosphate concentrations in figure 3d started low, at 0.1 μmol/L and steadily increased with depth. Station 20 increased most rapidly and reached 0.4 - the highest recorded concentration, by 30m.


Nutrients -
Initial Chemical Findings
Methodology
Physical
Biological
| Background |
| The Group |
| Methodology |
| Physical |
| Biological |
| Chemical |
| Methodology |
| Physical |
| Biological |
| Chemical |
| Methodolgy |
| Results |


