
The views and opinions expressed are solely those of the contributors, and do not necessarily reflect those of the University of Southampton or the National Oceanography Centre Southampton.
Falmouth 2015 - Group 7
Phytoplankton
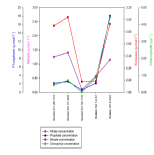
Figure 5a phytoplankton abundance was recorded for stations 61, 63, 64 and 65. At station 61, phytoplankton samples were taken at middle depth (9.2m) where a total of 121 cells/ml were found, with dominance of Chaetoceros compressum and Leptocylindrus danicus, both with 49 cell/ml. At stations 63, 64 and 65 the samples were taken at the surface, showing the changes in the phytoplankton community in terms of quantity.The abundance of organisms grow significantly as the top of the estuary is reached, which is likely due to the gradient in nutrient availability from the river end member to the seawater endmember. Overall, the species from the genus Chaetoceros exhibited dominance over the others, with Chaetoceros compressum being the most abundant in every station, reaching a total of 1046 cell/ml while the total for the remaining species reached only 366 cell/ml. The low values found for the station 61 are likely to be explained by the depth at which the sample was taken and the location of the site, and the depth of secchi disk was 7.20m, and therefore shallower than the depth of sampling, showing low light penetration, what is indispensable for phytoplankton growth. The total abundance of phytoplankton is consistent with the nutrient data (Figure 5c), with the lowest number of nutrients found at station 63, corresponding to the highest overall abundance of phytoplankton found here. Phytoplankton abundance can also be estimated from chlorophyll concentrations; however comparing this with the phytoplankton abundance graph it is not always consistent as the lowest value is found at station 63 where the highest abundance was found. This may be due to a number of external factors, including human error.
Zooplankton
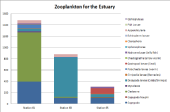
Three zooplankton samples were taken at three stations across the estuary. Zooplankton was recorded for stations 61, 63 and 65, representing the top, middle and bottom of the estuary. Station 61 recorded the greatest volume of zooplankton of any of the sites, corresponding to the lowest abundance of phytoplankton across the estuary being found here (Figure 5a). Figure 5b shows that of the of the 1485 individuals/m3 recorded at site 61, 58% were from the order Cladocera and 26% from the order Copepoda, followed by Polychaete Larvae and Appendicularia. Station 62 shows a drop in species volume and diversity. Of the 878.3 individuals/m3 recorded, 79% were Decapoda larvae, 12% were Copepoda and the remaining belongs to only 3 more different groups. Station 63 shows an increase in diversity and decrease in volume. Of the 304.9 individuals/m3 recorded, 34% were Copepoda, 28% were Gastropod larvae and 16% were Decapoda larvae.
Methodology
Physical
Chemical

Estuary Phytoplankton and Zooplankton - Initial Biological Findings
Redfield ratio
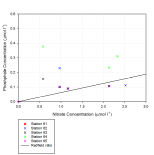
Figure 5d shows that the molecular composition of the phytoplankton does not consistently follow the Redfield ratio at all stations. Stations 63 and 64 show that nitrate is limiting, this is consistent with the low nutrient concentrations found at this station (Figure 5c) and high phytoplankton abundance (Figure 5a). Remaining stations, with higher nutrient concentrations, are generally more consistent with the Redfield ratio.
| Background |
| The Group |
| Methodology |
| Physical |
| Biological |
| Chemical |
| Methodology |
| Physical |
| Biological |
| Chemical |
| Methodolgy |
| Results |


