
The views and opinions expressed are solely those of the contributors, and do not necessarily reflect those of the University of Southampton or the National Oceanography Centre Southampton.
Falmouth 2015 - Group 7

Temperature and Salinity
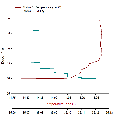
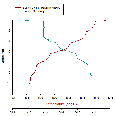
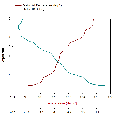
Figures 4a-4d show profiles of salinity and temperature for the stations sampled up the Fal Estuary. Each profile shows a similar pattern, suggesting that temperature decreases with depth, whereas salinity increases. All profiles except for station 61 (fig.4a) show a sudden change in both salinity and temperature, this is likely due to layers of freshwater sitting at the surface due to differences in density. Station 61 does not exhibit the same characteristics as it is the most marine of all the stations, located at the mouth of the estuary (see map 6) as opposed to further up the estuary,like all the other stations.The gradients in both temperature and salinity are thus much more pronounced further up the estuary, this can be seen when looking at fig.4d, which exhibits consistent change in these parameters with depth. No data was taken for station 63 as there was an error with the CTD.
Richardson Number
The Richardson number (Ri) was calculated using the flow velocities on the ADCP and the profiles measured by the SONDE meter, which was attached to a CTD rig. Ri was measured to observe the nature of the flow stability, whether it was laminar or turbulent. Ri values below the 0.25 critical value are considered to indicate turbulent flow whereas any numbers above 1 indicate laminar flow. Any values between these show a transition.
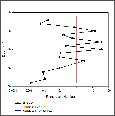
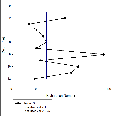
Figure 4e shows the Richardson number (Ri) for station 61 at this station is lower at the surface and near the seafloor, this indicates turbulent flow at the top and bottom of this point of the estuary. Between 5m and 15m, the Ri value fluctuates between laminar and turbulent flow.
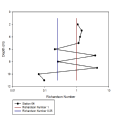
At station 63 (figure 4f) in the estuary, the Ri number is showing a mainly turbulent flow from 3m to seafloor (Ri is less than 0.25), at the surface, the Ri number is above 1, so the flow is laminar. There are also a few points at and below 8m where the flow is also laminar.
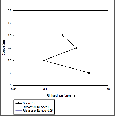
At station 64, figure 4g showed mainly laminar flow, with a few exceptions in the mid-depths and near the seafloor. There are a few points where the flow changes rapidly between laminar and turbulent flow.
At station 65, the depth was shallow, so the flow at this station was variable. This is shown by the Ri numbers being close to the critical values and showing a transition between laminar and turbulent flow.
Estuary flow and flux
Using the data collected by the ADCP and use of Google Maps and tide times, it is possible to calculate the net flux of water from the estuary and also the tidal flushing period.
To calculate the net flow and from that, the change in depth of the area, the difference in Total Q (total flow of water through the transect) between two transects was found. Using that difference, the change in depth of the section, in meters per second, was found by dividing the difference by the distance between the transects. This was then converted to cm per hour to give a more realistic measurement.
For the Carrick Roads area, which is the area between transect 0 and 1, we calculated a net flux of -3605.641 m^2/s, which results in a depth change of -28 cm/hour. This value only takes the flux of the Fal river and none of the other river inputs.
Along the river, the flux decreases the further up the river, dropping from around -415 m^2/s at the end of the river to -30 m^2/s. This is shown by the change in the rate of change of river depth between the area next to Carrick roads and the end member where the values dropped from -8.68 cm/hour to only -0.40 cm/hour. This change can be explained by both the narrowing of the river and thus the weaker effect of the tide. Also, the ADCP transect was taken close to low tide, so there was even less of an effect from tide, due to being at slack water.
The Tidal flushing period is used to estimate the flux of materials in bodies of water where the tide has a stronger effect than riverine flux. By using a tidal prism, the amount of water moved out of the estuary can be found. The tidal prism assumes that tidal flow removes all water from the prism over a tidal cycle (12.42 hours). The size of the tidal prism was calculated by multiplying the surface area of the estuary with the tidal range. The tidal flushing period is then calculated by dividing the volume of the estuary by the size of the tidal prism then multiplying the result by the tidal cycle.
The equation gave a result of 42.44 hours for the estuary to be completely flushed using tides alone.
This was calculated assuming that there is no water flushed by the tide returns on the ebb, also, it assumes that all of the water in the prism is removed, which is often not the case due to water being trapped in eddies and embayments in the estuary.

Estuary Water Column Properties - Initial Physical Findings
Methodology
Biological
Chemical
| Background |
| The Group |
| Methodology |
| Physical |
| Biological |
| Chemical |
| Methodology |
| Physical |
| Biological |
| Chemical |
| Methodolgy |
| Results |
