
The views and opinions expressed are solely those of the contributors, and do not necessarily reflect those of the University of Southampton or the National Oceanography Centre Southampton.
Falmouth 2015 - Group 7
Dissolved Oxygen
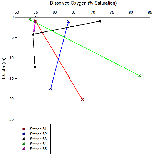
Figures 6a-6d exhibit profiles of the difference chemical parameters measured in the estuary. Figure 6a shows how dissolved oxygen (% saturation) changes with depth. A distinct change with depth is shown here, however, the pattern varies from one station to another, for example, stations 61 and 64 show overall increases in dissolved oxygen with depth, whereas stations 62 and 63 show overall decreases with depth.
Nitrate
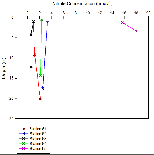
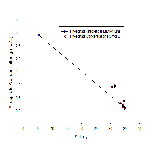
Figure 6b shows nitrate profiles for stations 61-65. Stations 61-64 all show relatively similar profiles, with surface values between ~1-3.5, concentration at these stations also remains mostly constant with depth. Station 65 however has a much higher surface concentration of Nitrate (around 15.8µmol/L), unfortunately the depth of the estuary at this point prevented a full profile from being plotted, meaning it is difficult to draw comparisons with the other stations which were deeper. Figure 6b is accompanied by figure 6e - a mixing diagram for nitrate - this shows how nitrate concentration is expected to change with salinity. Unfortunately, due to the nature of the Fal estuary, we were unable to reach the very top on R.V.Bill Conway, meaning a full range of salinities could not be sampled. Despite this, the spread of data below the theoretical dilution line (TDL) does suggest some form of nitrate removal,most likely through biological processes occurring within the estuary, thus suggesting non-conservative mixing.
Silicon
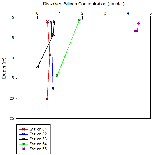
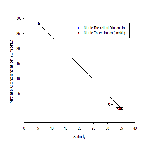
Figure 6c shows how dissolved silicon levels change with depth. The pattern shown here is similar to that shown in nitrate profiles,with stations 61-64 showing relatively low levels that don't change much with depth. Station 65 however shows a much greater concentration (over 4 µmol/L), the same problem occurs here as with nitrate as the lack of depth prevents a comparative profile from being constructed. Figure 6g shows the mixing diagram for silicon, this shows a very different situation from the nitrate mixing diagram, as its points scatter above the TDL rather than below it. When concentrations plot above the TDL, this suggests addition to the system. Silicon is generally added to estuary system through the weathering of silicate rocks, followed by riverine transport, thus causing fresher waters to be higher in silicon, this supports what is shown in figure 6c, as station 65 was the most riverine of all stations.
Phosphate
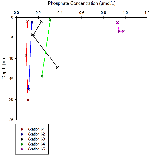
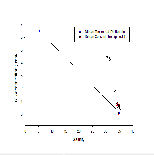
Figure 6d shows phosphate profiles at each of the stations sampled. This graph also shows similar trends to figures 6b/c, stations 61-64 have surface concentrations of around 0.1-0.3µmol/L, whereas station 65 has phosphate concentrations of over 0.9µmol/L. The mixing diagram for phosphate (figure 6f) uncharacteristically shows addition of phosphate to the system, it would be expected that removal would occur as a result of biological activity using phosphate. Despite this, additio of phosphate is also possible as there are numerous small scale point sources along the estuary that may result in spikes in phosphate, for example input of sewage can cause unusually high levels of riverine phosphate(18).
Methodology
Physical
Biological

Estuary Nutrients -
Initial Chemical Findings

| Background |
| The Group |
| Methodology |
| Physical |
| Biological |
| Chemical |
| Methodology |
| Physical |
| Biological |
| Chemical |
| Methodolgy |
| Results |
