
The views and opinions expressed are solely those of the contributors, and do not necessarily reflect those of the University of Southampton or the National Oceanography Centre Southampton.
Falmouth 2015 - Group 7

Water Column Properties - Initial Physical Findings
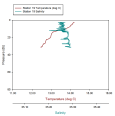
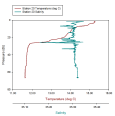
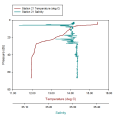
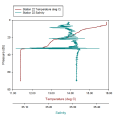
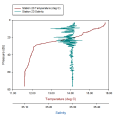
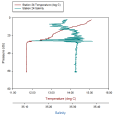
Across all stations there was a clear decrease in temperature with depth, the largest decrease was found at the thermocline, which could be clearly seen between 20-30m, with variations in stratification above this level. However, there were exceptions to this as station 19 had a less significant thermocline, indicating increased mixing; whereas station 22 shows temperature decreasing in steps suggesting that there was increased stratification occurring in this area, with a well defined thermocline as temperature rapidly decreased by 2oC in less than 5m.
Despite fluctuations and salinity spikes in the profiles, the depth profiles show expected trends in salinity for an offshore site. The plots produced show only a slight decrease in salinity with depth due to the increase in density but little freshwater input and levels staying fairly constant below the thermocline. Salinity was fairly constant over all stations and depths remaining within 0.2 of the starting salinity.
For station 19 (figure 1a), temperature showed a steady decrease with depth from 14.2 degrees to 12.5, the thermocline was present at 12db where a drop of 1 degree was recorded. Salinity increased following the thermocline from 35.25 to 35.31. At station 20 (figure 1b), temperature decreased from 15.5 to 11.7 degrees by 65db, a thermocline was observed at 30db showing a drop of 2 degrees. Salinity remained fairly constant at 35.32 psu other than a spiked decrease at 25db to 35.18 before returning to the previous constant salinity. At station 21 (figure 1c), temperature decreased with depth, 15.5 at surface to 12 at 70db. A thermocline at 25db coincides with a decreasing spike in salinity. Salinity variable around 35.30 until 30db then very constant at 35.32. At station 22 (figure 1d), temperature decreased from 16 degrees to 11.5 over 70db, with a thermocline at 32db, after which the temperature remains constant at 11.5. the salinity is extremely varible until the thermocline starting at 35.28 and varying between 35.02 and 35.46, following the thermocline salinity remains steady at 35.33. At station 23 (figure 1e) temperature ranged from 15.8 at the surface to 11.5 at 75db. A thermocline was detected at 25db, there was a small variation in salinity above thermocline, however, below that salinity remained steady at 35.30. With station 24 (figure 1f) the temperature range from 15 at surface to 11.8 (change of 3.2 degrees) at 60db. Following a thermocline at 28db, temperature remained constant at 11.8, salinity was also constant at 35.32 after the thermocline but was variable before.
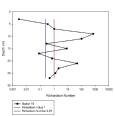
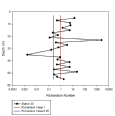
Using current flow data from the ADCP and density data from the CTD, Richardson numbers (Ri) were calculated in order to determine whether mixing occurred at recorded depths by assessing whether flow was turbulent or laminar.
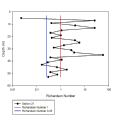
At station 19 (figure 1g) Richardson numbers (Ri) are lowest at the surface and at mid-depths; these points are defined as those with Ri values less than 0.25 (critical value) indicating turbulent flow. The majority of other depths throughout the water column indicate laminar flow (Ri values above 1), with several mid-depth values occurring in the boundary between laminar and turbulent flow. These results are reflected in the CTD data, showing most mixing occurring at the surface and temperature indicating stratification where flow is laminar.
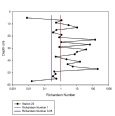
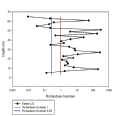
At station 20 (figure 1h) the Ri values indicate mostly laminar flow occurring throughout the water column, with the exception of several mid-depth turbulent values that indicate mixing. This is expected as the CTD profiles show stratification where flow is laminar. At station 21 (figure 1i), Ri values indicate turbulent mixing at the surface due to extremely low Richardson number. Throughout the mid-depths in the water column flow moves from laminar into the transition zone between laminar and turbulent flow, including flow at greatest depth recorded. The profiles from the CTD show a small amount of mixing at the surface with some stratification immediately after.
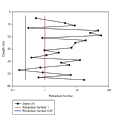
At station 22 (figure 1j), turbulent flow can be seen both at the surface and the base of the water column, with all mid-depth values indicating laminar flow as well as in the transition between laminar and turbulent flow. This is also shown by the CTD where the majority of stratification is shown at mid-depths where flow is indicated as laminar by Ri values. At 23 (figure 1k), turbulent flow occurs mainly at the surface as well as at the base of the water column with the majority of mid-depth flow being laminar, with fairly stable stratification at these depths. At 24 (figure 1l) the majority of flow is laminar, indicated by high Ri values with some possible turbulence towards the base of the water column; this is reflected in the CTD profiles as little mixing occurred here.
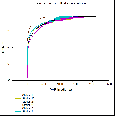
The CTD also measured the light available for photosynthesis - irradiance, producing depth profiles that show the expected trend - an exponential decrease with depth (figure 1m). At all stations minimum light levels were reached around 30m depth.
Methodology
Biological
Chemical

| Background |
| The Group |
| Methodology |
| Physical |
| Biological |
| Chemical |
| Methodology |
| Physical |
| Biological |
| Chemical |
| Methodolgy |
| Results |
