
Introduction
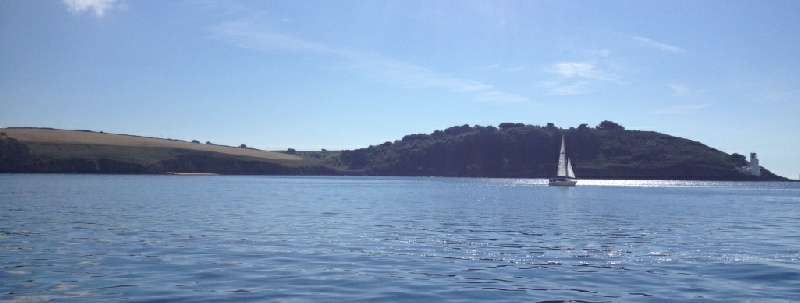
Stratification of shelf seas occurs as an annual cycle, influencing nutrients and productivity. Above 40° latitude, stratification only occurs during spring and summer due to increased heat input, which leads to the formation of a thermocline. This stratification fuels primary production in the summer months, as the waters are nutrient rich following high levels of mixing during the autumn and winter, which allows nutrients to upwell and be recycled throughout the water column (Johnsen et al, 2002). Stratification eventually breaks down during the autumn months due to increased wind forcing and decreased heat input, which can no longer sustain a thermocline. This also correlates with increased river inputs (Huang et al, 1999). By taking various measurements of the water column off the south coast of Cornwall, the seasonal stratification in this region was identified, along with other physical and biochemical parameters.
Click images to enlarge
The Richardson number
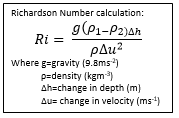
The Richardson Number (Ri) distinguishes between laminar and turbulent flows within a water column. It is defined as the ratio between the buoyancy force and the flow gradient. If the Richardson number is less than 0.25, flow is said to be turbulent (promoting mixing), while values of above 1 are laminar, and mixing will not occur. By identifying layers with varying flow characteristics, the location of physical structures such as tidal fronts and thermoclines can be seen; especially when the Richardson number is used in conjunction with data collected using a CTD. ADCP and CTD data collected on the RV Callista on the 30th June 2015 was used to calculate the Richardson number at various depths in the water column, allowing depth profiles to be generated.
Figure 5.16 shows each station sampled during the survey. An estimation prediction of the approximate location of the tidal front is plotted at point 07:30.
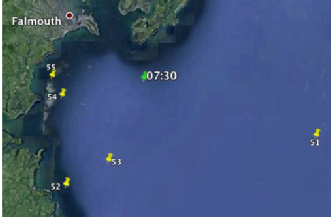
The stratification of the water column can indicate the position of the tidal front. Before the tidal front, in deeper waters, heating of the surface waters causes stratification which overcomes tidal mixing. After the tidal front, tidal mixing overpowers the thermal stratification of the water, generating a well mixed water column. This pattern can be observed in the CTD profiles of various parameters at each station, which can then be used to predict the approximate location of the tidal front.
Station 51
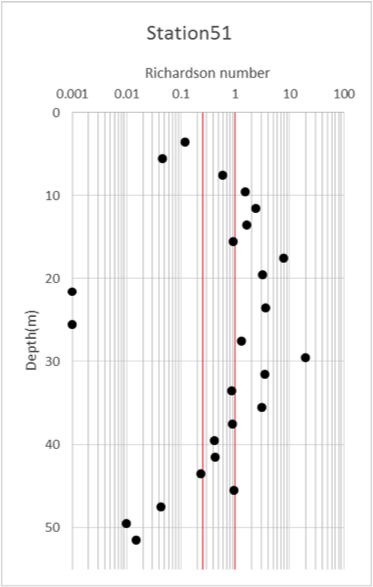
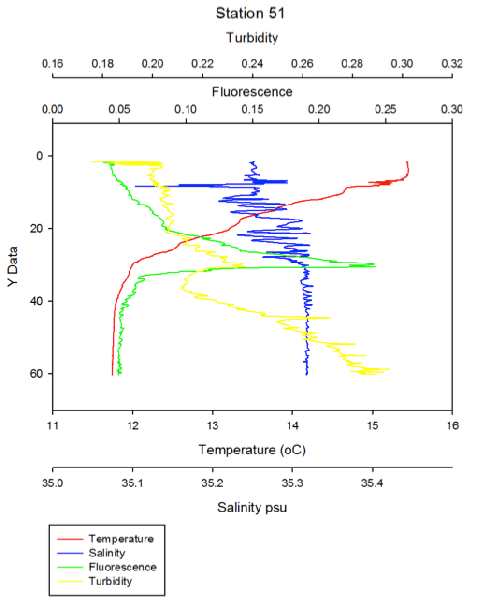
This station was the furthest offshore location that could be sampled due to the adverse conditions experienced on the 30/06/2015. The clear stratification of the water column at station 51 can be seen in Figures 5.17 and 5.18. A surface mixed layer can be identified from the turbulent upper layer of the water column, with Ri values of <0.25 (Figure 5.17). In Figure 5.18 this mixed layer can be observed up to 10m.
Between 10 and 40m flow is generally laminar, bar some turbulent mixing occurring at 22-26m depth. This corresponds to the depth of the thermocline, which can also be observed in Figure 5.17 at the same depth, with characteristic turbulent flow. The turbulence between 22 and 26m could be due to internal waves causing mixing along the boundary layer.
Turbulence increases below 40m, suggesting that mixing is occurring, potentially due to friction with the seabed. Fluorescence values show a clear chlorophyll maximum at approximately 28m, coinciding with the bottom of the thermocline.
Station 52
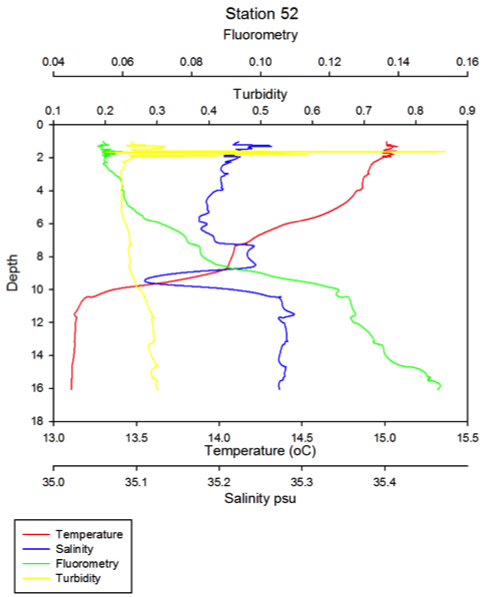
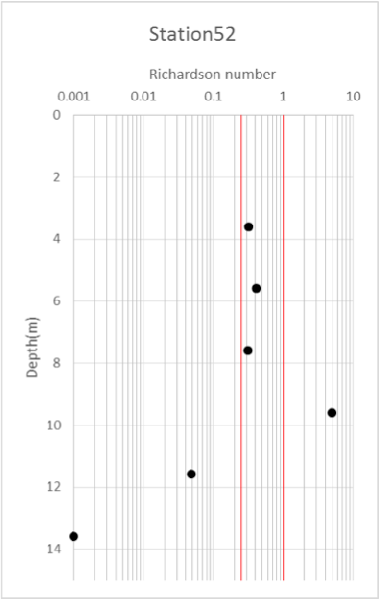
Here, stratification can be identified by high Ri values (Figure 5.19), which indicates stable, laminar flow caused by the lack of mixing at the surface, as heat input generates a calm upper layer. Also, sampling occurred approaching low tide at 11:04BST, meaning that turbulence due to tidal mixing was relatively low. Below ~9m this stratification breaks down, possibly due to a thermocline. This can be identified by the Ri values decreasing to below 0.25, inferring that instability and mixing is occurring. The CTD data profiles (Figure 5.2) support that a thermocline is present between depths of 2 and 10m, lying below a surface mixed layer.
The total water depth decreased dramatically between stations 51 and 52, as station 52 is much closer to shore than station 51. Beneath the thermocline mixing occurs, which due to the decrease in water depth is likely caused by shear stress against the seabed. The chlorophyll maxima is no longer visible, and chlorophyll values increase steadily with depth.
Figure 5.2 shows high turbidity on the surface at the tidal front, which suggests the presence of eddies. Eddies are a common feature near tidal fronts due to the sustained vertical motion caused by convergence of the tidal front (Owen, 2013).
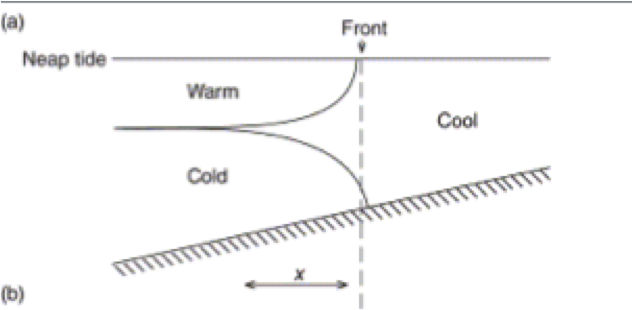
This station is assumed to be along the dotted line shown in Figure 5.21 which shows a visualisation of a tidal front system.
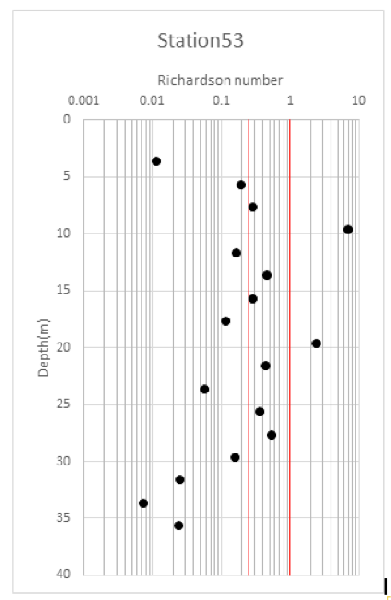
Station 53
Here, flow was predominantly turbulent with the majority of Ri values being lower than 0.25 (Figure 5.22). Turbulence at the surface (around 3.5m) could have been due to wind forcing, as the meteorological conditions had generated a large swell with breaking waves. A high Ri value of 10 at 10m signals a thin layer of highly laminar flow, with very little mechanical mixing occurring.
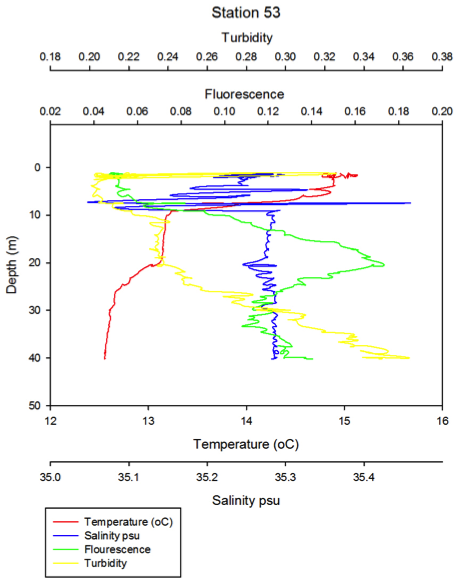
Figure 5.23 shows the CTD profile for this station, with stratification being present. Features of the water column include a thermocline and a chlorophyll maximum at the bottom of the thermocline, at around 20m depth. This station was further out to sea than station 52, and experienced strong stratification and a chlorophyll maximum as a result.
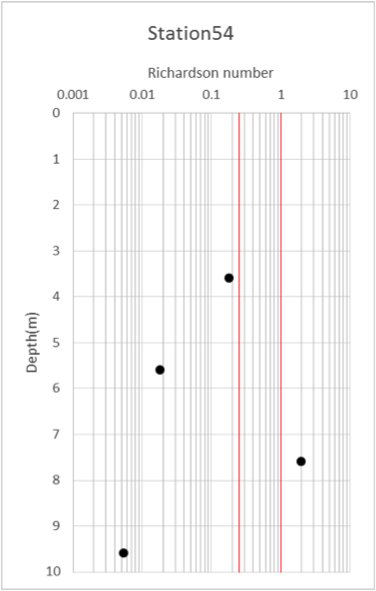
Station 54
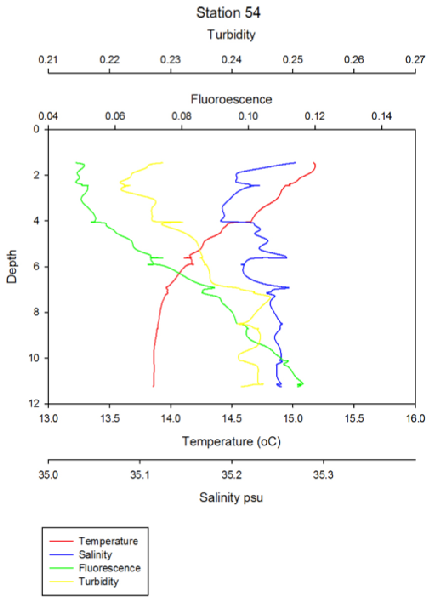
Figure 5.24 shows that this station exhibits large levels of mixing, with Ri values of less than 0.25. This has lead to the water column becoming well mixed. As this site's location is closer to the coast, tides play a larger role in mixing the water column, along with wind mixing. Due to the shallow water depth, these two sources of turbulence meet and lead to largely homogeneous waters with regards to temperature and salinity, which can be seen when examining the CTD profile for this station (Figure 5.25). The CTD profile consequently shows that at this station the water column is becoming more mixed, with gradients for temperature, salinity, fluorescence and turbidity being much less steep than at other stations sampled. Due to a lack of a thermocline or chlorophyll maximum, the assumption that we had passed the tidal front and entered into the well-mixed coastal zone could be made..
Station 55
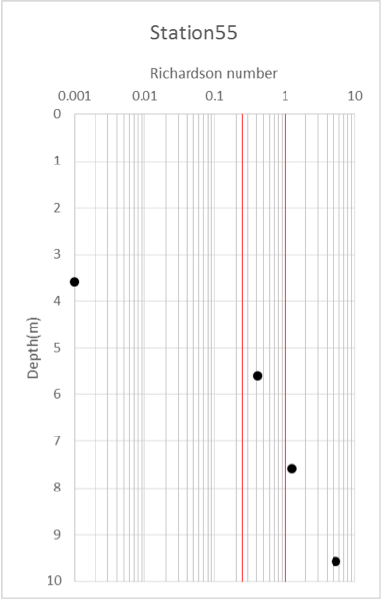
The highly turbulent value shown on the Ri profile (Figure 5.26) with a value of 0.001 was actually a negative value (changed to maintain the structure of the graph). Negative Ri values are caused by dense waters lying on top of lighter waters, which will automatically cause mixing by instability due to the difference in density, causing instability.
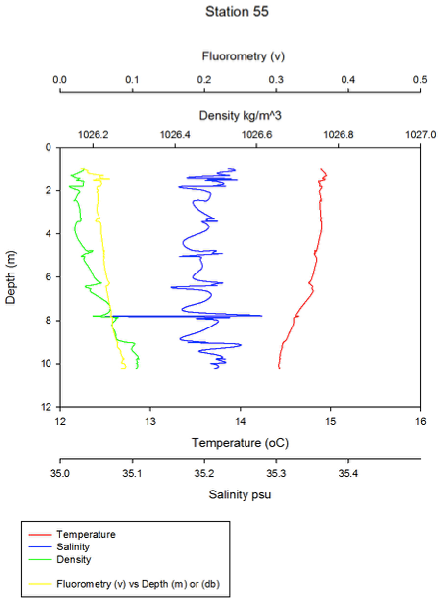
Again, the CTD profiles (figure 5.27) at this station show a well mixed water column, which is further evidence that the vessel had, at this stage, crossed the tidal front. The temperature here is cooler than the warm surface waters in the stratified region, but warmer than the cold water beneath the thermocline in the stratified waters such as can be seen at station 51 (Figure 2.18). A visualisation for this phenomenon can be seen in figure 6.
Horizontal gradients
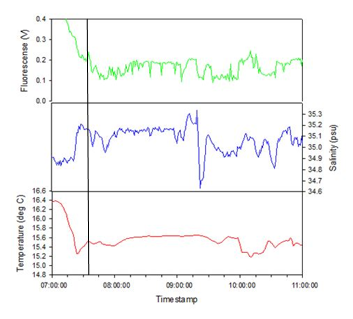
Figure 5.28 shows a continuous record of the fluorescence, salinity and temperature values against time during the survey. Locations where the vessel crossed the tidal front are characterised by changes in these horizontal gradients. As the transect began, low salinity, high chlorophyll and higher temperature values were recorded, due to leaving the Fal Estuary. As the vessel travelled out of the estuary, it moved into the well-mixed area preceding the tidal front. The salinity increased while fluorescence and temperature decreased. As time progressed, at 07:30UTC an increase in temperature and decrease in fluorescence could be due to the vessel crossing the tidal front, shown by a line on figure 5.28. When plotted on a map (Figure 5.16), this point is positioned in a place that coincides with the data collected and interpreted from the CTD profiles, as it occurred whilst travelling towards station 51.
References
Huang, D., Su, J. and Backhaus, J.O. (1999) Modelling the seasonal thermal stratification and baroclinic circulation in the Bohai Sea, Continental Shelf Research, Vol 19(11), Pages 1485-1505.
Johnsen, T., Nygaard, K. And Olsgard, F. (2002) The North-east Atlantic Ocean- huge, deep and heavily exploited, European Environment Agency, available from: http://www.eea.europa.eu/publications/report_2002_0524_154909/regional-seas-around-europe/nea_ocean.pdf (Last accessed 02/07/2015)
Owen, R.W. (2013) Fronts and Eddies in the Sea: Mechanisms, Interactions and Biological effects. Published by BiblioLife.
| Chemical |
| Biological |
| Physical |
| Biochemical |
| Physical |