
Method
A CTD rosette deployment was implemented at every station. The depth profiles created from this data can be used to show the changes in physical characteristics in the water column along the estuary. A Secchi disc was lowered into the water column at each station to enable analysis of turbidity and calculation of the photic zone depth. An ADCP transect could not be performed as intended, due to equipment malfunction.
Physical properties of the Fal
Introduction
Understanding the physical aspects of any estuary is of paramount importance when drawing conclusions about distributions and cycling within the estuarine system. The main physical parameters that were studied were salinity, turbidity and temperature. These together can give a comprehensive insight into the circulation and distributional behaviour in the Fal Estuary.
Salinity - results and discussion
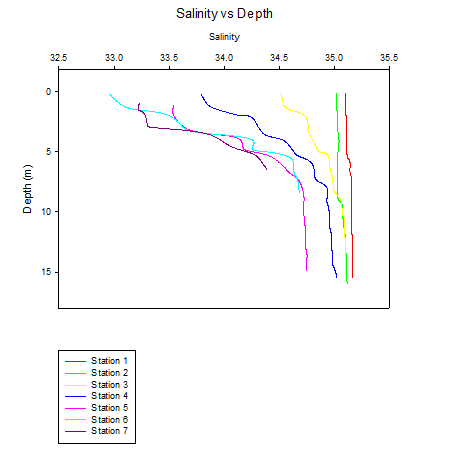
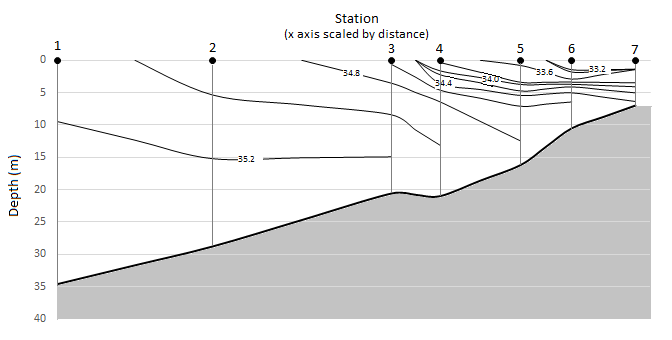
From the salinity depth profiles, a contour plot of the sampled area was produced (Figure 3.12). Geomorphology of the estuary restricted the sampling area such that the contour plot only displays a narrow salinity range. Figure 1 reveals a complex estuarine environment in which riverine flow dominates.
Stations 1 through to 3 are more saline, but show weak tidal mixing, leaning to a more partially mixed structure. Later stations exhibit the start of a weak salt wedge, as isohaline lines shoal closer together at the estuary floor and become more horizontal. The null point lies upstream of the sampling area, however as aforementioned, the restricted area of sampling meant that more data is needed to confirm the speculations (Figure 3.13).
Temperature - results and discussion
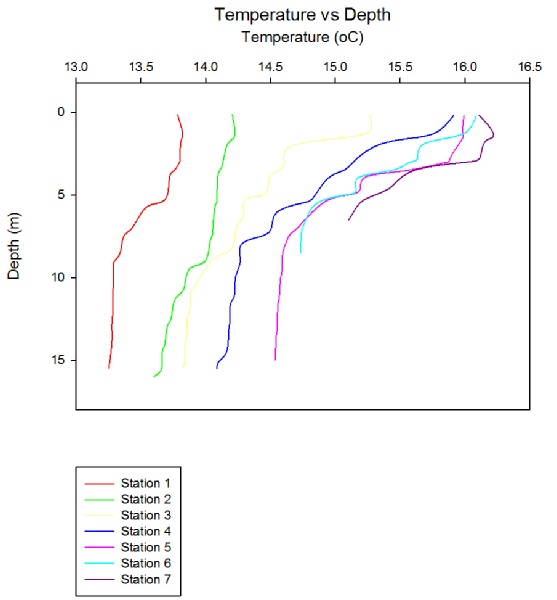
Temperature profiles show a clear trend of warming up the estuary, the more riverine waters contain a more severe thermocline due to the river water being much warmer than the oceanic water it is entering. As the warmer freshwater flows out to sea, it appears that sub surface entrainment occurs, mixing the temperature down into the salt wedge. There is evidence to suggest that the salt wedge pushes further upstream from the sampling area as cooler marine waters are seen at the base of the estuary, even at the most riverine locations (Figure 3.14).
Turbidity - results and discussion
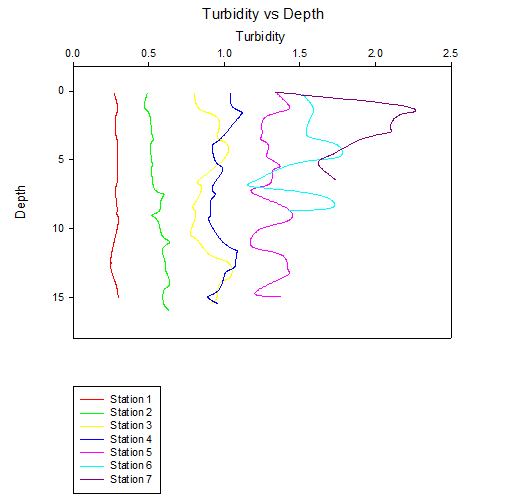
It is possible to observe uniform distributions on the turbidity profiles for each station. This can be said for each station until the flow starts to interact with the seabed within the surveying depths. The boundary layer structure can be observed within the profiles from station 5 to 7, due to the fact that the surveying included water within close proximity of the benthos (Figure 3.15).
The interaction of flow and sediment creates high suspended particulate matter (SPM) and therefore high turbidity. This turbidity facilitates primary productivity for small phytoplankton such as diatoms that do well in turbid environments.
Summary of Findings
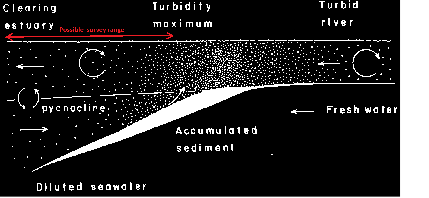
This evidence together provides a strong indication that the estuary behaves as both a partially mixed, and a salt wedge estuary. The partially mixed area is shown nearer the mouth of the estuary and Carrick roads where the depth is much greater and the estuary is much wider so riverine flow is less able to dominate. Further inland salt wedge behaviour can be observed as the estuary becomes much more shallow and narrow. A turbidity maximum is not observed within the sampling range however the turbidity does increase further up the estuary implying a null point may lie further upstream from station 7.

Original planning involved using an ADCP to profile flow rates and the Richardson number to further elucidate the estuary structure, unfortunately the ADCP on board was in broken at the time.
References
Fisher, T. R., Melack, J. M., Grobbelaar, J. U. & Howarth, R.W. (1995). Nutrient limitation of phytoplankton and eutrophication of inland, estuarine, and marine waters.. In: H. Tiessen (ed.), Phosphorus in the Global Environment, SCOPE #54. Wiley & Sons, Chichester, 301-322.
Euphotic zone
The depth of the euphotic zone base (calculated from the Secchi Disc depth) is shown to decrease with distance away from the Fal Estuary mouth, as the maximum depth of the estuary bed likewise decreases. This suggests that turbidity in the water column is lower as the water body approaches the mouth of the estuary.
The fact that turbidity increases with distance from the estuary mouth is owing to higher Suspended Particulate Matter (SPM) levels (increased proportions of eroded material transported by rivers), as well as an intensification of mixing in the water column as a result of a shallower depth.
Between Stations 5 and 7 (where the depth of the estuary bed decreases from 16.2m to 7m), the base of the euphotic zone approaches the maximum estuary bed depth. This trend continues until, at Station 7, the base of the euphotic zone is found to be 0.5m deeper than the depth of the estuary. Though this seems an odd concept, it simply means that at this station, no part of the water column was below the euphotic zone (Figure 3.16).
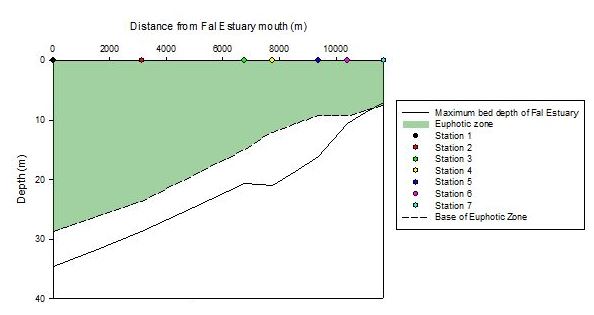
The regression line is likely to have been affected by the time the measurements were taken relative to the tidal state. Stations 1 and 2 were taken prior to high water when the tide was flowing whilst the others were taken during ebb tide. This may account for the separation of the first two data points from the others.
Click images to enlarge
| Chemical |
| Biological |
| Physical |
| Biochemical |
| Physical |