
Introduction
A Niskin bottle was deployed at three depths (Stations 1 to 3), or two depths (Stations 4 to 7), according to the depth restrictions of the estuary at that site. Separate water samples were extracted and processed while on board the R.V. Bill Conway for chlorophyll, silicon, phosphate, nitrate, and dissolved oxygen.
Nutrients - Method
At each station along the estuary, water samples were extracted from the Niskin bottle each time it was deployed at different depths, for eventual analysis of silicon, nitrate and phosphate concentrations. Once retrieved, the water samples were processed and analysed according to the methodology in the literature, for silicon and phosphate concentration (Parsons et al. 1984), as well as nitrate concentration (Johnson and Petty 1983).
Chemical properties of the Fal
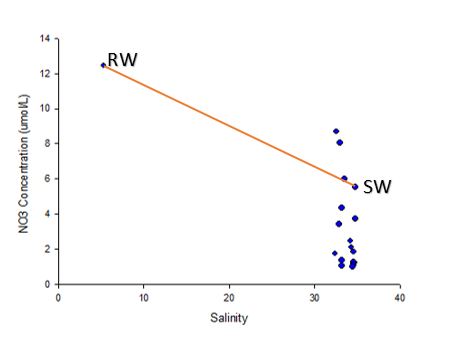
Nitrate
The riverine end member value are of greater concentrations than the seawater end member. Values are distributed towards the mouth of the estuary as the survey vessel was only able to travel so far up the river(Figure 3.6).
The majority of the values are beneath the theoretical dilution line suggesting that nitrate behaved non-conservatively within the estuary, with an overall removal of nitrate in the collected water samples. Fewer values lie above the TDL, confirming that less addition than removal is occurring in the water column.
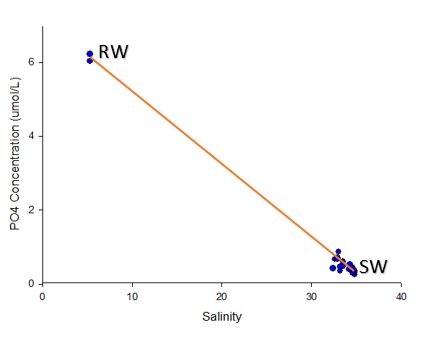
Phosphate
The concentration of phosphate at the riverine end member concentration is significantly higher than the marine end member. All the values do however lie more or less along the TDL, but there is very slightly more removal of phosphate than addition. The closeness of values to the TDL suggests conservative behaviour of phosphate in the estuary (Figure 3.7).
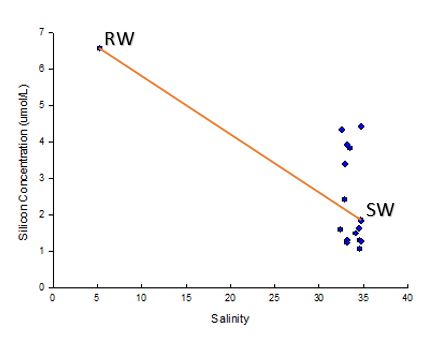
Silicon
The riverine end member has a higher concentration than the seawater end member due to the river usually being the main source of nutrients. Values are clustered around the marine end member as our survey vessel was unable to get further up the river towards the river end member location (Figure 3.8).
The data plots fairly equally on either side of the TDL, suggesting overall conservative behaviour of silicon in the estuary.
Dissolved oxygen
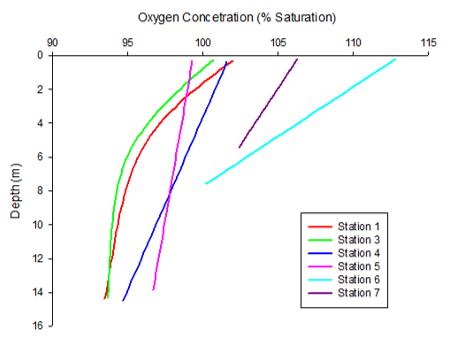
Figure 3.9 shows the data collected from analysis of the samples from stations 1 through 7. The samples were analysed using the Dissolved Oxygen method (Crasshoff et al., 1999). This provides a more accurate way of measuring oxygen by using a chemical titration, rather than solely using electronic CTD data. The main constraint of this method is that it is very time consuming and to in order to get a good resolution, multiple samples must be taken. There were 3 samples collected at stations 1 through 3 while only 2 were taken at stations 4 through 7 (Figure 3.9).
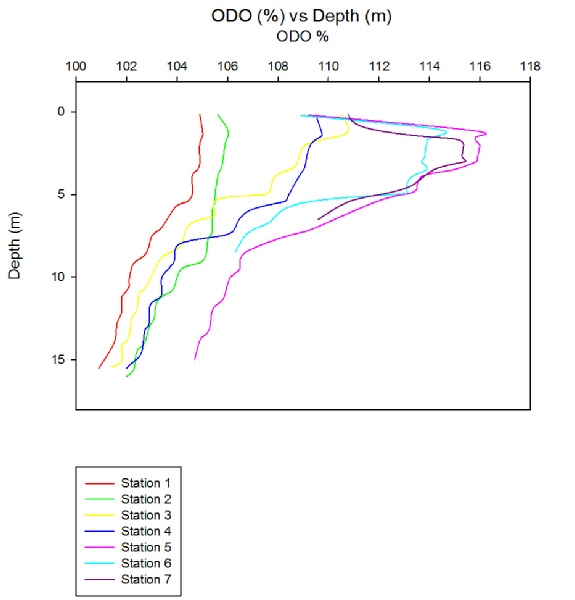
Data from the CTD was used to create a more thorough depth profile (Fig. 2). The CTD gave a higher spatial resolution than the lab analysis of samples, however oxygen levels are less accurate. The greater spatial resolution of the CTD data allows for detailed trends to be recorded in the water column, with even very small features being recorded. In both figure 1 and 2, a clear trend is visible. The further up the estuary the samples are taken, the more stratification there is. Station 1 has little variation of oxygen with depth, ranging from 101% to 105%; whereas station 5 ranges from 105% to 116%. There is an overall flat increase in oxygen concentration too. The lowest oxygen level for each station is higher than the lowest for the previous station. This could indicate that the riverine water has a higher concentration of oxygen than that of the seawater. The only exception to this is station 5 which has unusually high oxygen levels. This could be due to high chlorophyll levels, meaning more photosynthesis and ultimately, higher oxygen levels. (Figure 3.10).
Station 5 was at a fork where the river Truro meets the river Fal, this could be because the river Fal may have a greater concentration then that seen in the Truro.
Click images to enlarge
| Chemical |
| Biological |
| Physical |
| Biochemical |
| Physical |