
Zooplankton
Method
A plankton net (mesh size 200µm, diameter 0.5m) was trawled for 5 minutes at two stations to obtain a zooplankton sample from the water column. At Stations 51, the net was lowered to 30m and brought back up to the surface using a winch system on the vessel; whereas at Station 55, the sample was taken from 10m depth to the surface. Both nets were kept open during sampling. Water samples collected were later examined for zooplankton community structure, via a light microscope; these counts were used to give an estimation of the number of zooplankton per m³ at different sites within the estuary.
Phytoplankton
Method
100ml water samples were also collected from the Niskin bottle each time it was deployed (see chlorophyll method), for analysis of phytoplankton communities at Stations 1,3,5,6 and 7. Samples were examined through a light microscope; these counts were used to give an estimation of the number of phytoplankton per m³ at different sites within the estuary.
Results and Discussion
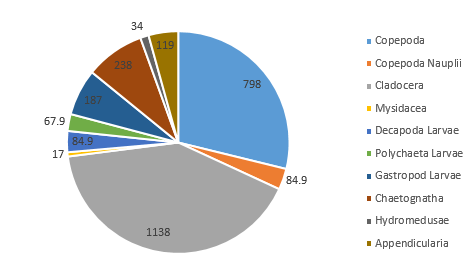
The zooplankton community located at Station 51 (on the side of the coastal front furthest from the coast) consisted of mostly of Cladocera (41.1% of community), and Copepoda (28.8%, or 31.9% of the total zooplankton in the sample if copepod nauplii are included in this figure) (Figure 5.4). Other groups found in significant proportions in the sample included Gastropod larvae (6.8%) and Chaetognatha (8.6%) (Figure 5.4).
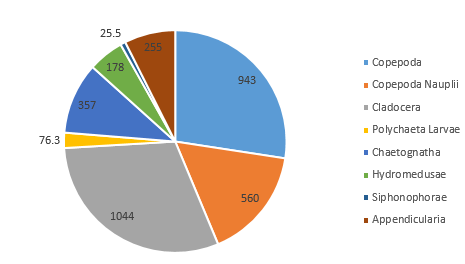
At Station 55, on the side of the front nearest to Falmouth coast, the proportionally largest taxonomic groups found were, again, Cladocera (30.4%) and Copepoda (27.4%) (Figure 5.5). However, a 13.2% higher proportion of copepod nauplii were observed in this sample than at the previous station, and although no gastropod larvae were seen, 2.5% of the community from Station 55 featured Polychaeta larvae (which were not noted in Station 51) (Figure 5.5).
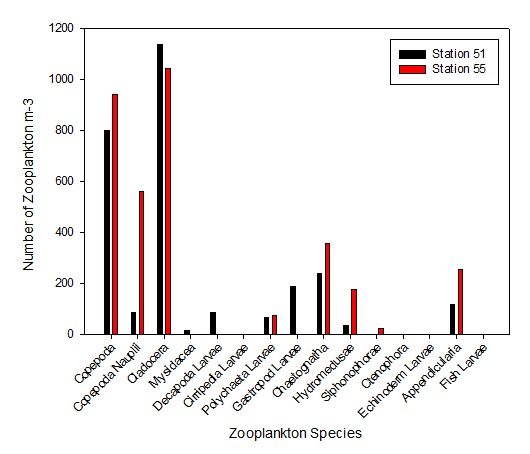
As the most abundant metazoans inhabiting the ocean (Davies et al. 1999), it is unsurprising that planktonic copepods appear to be among the two most dominant taxonomic groups found in the two locations (Figure 5.6). As Cladocera zooplankton feature as the largest group in both stations (Figure 5.6), it can be assumed that the time of sampling coincided with suitable conditions for a large population of these species (such as high food availability of phytoplankton). Other observed groups included the meroplankton Hydromedusae, which were particularly prevalent at Station 55 nearer to the coast, perhaps as a result of more favourable temperatures and a higher copepod population as a large food source (Matsikis, 1993) (Figure 5.7).
Nevertheless, relatively similar compositions of zooplankton predatory communities were found at either side of the front, perhaps mirroring phytoplankton food sources that were also not dissimilar. The deeper water sampled at Station 51 (nets were deployed to 30m, as opposed to 10m at Station 55) yielded a higher species diversity, yet a lower species abundance (Figure 5.6).
Some differences between the communities of zooplankton on either side of the coastal front can perhaps be attributed to the differences in stratification (which increases across the front, moving away from the well-mixed coastal water body). A higher abundance of copepod nauplii (Figure 5.6) was observed in the sample taken from Station 55, which may well be due to a higher level of nutrients circulated to the surface promoting phytoplankton blooms (in turn this available food source created ideal conditions for early stage zooplankton growth).
However, it could also be suggested that the nauplii had not yet developed the diurnal migration patterns characteristic of adult copepods (Daro, 1985). As copepods are strong swimmers, they are able to withstand strong tidal currents (such as those seen further away from the coast, hence their ability to dominate the community) and cycle down daily to feed on the phytoplankton accumulating at the Deep Chlorophyll Maximum (DCM). The sampling nets were not closed at depth, however, thus a profile of changing zooplankton communities with depth could not be made. Furthermore, only two samples were taken from one position each side of the coastal front; therefore the results found may not be a true representation of the zooplankton community off the coast of Falmouth.
Results and Discussion
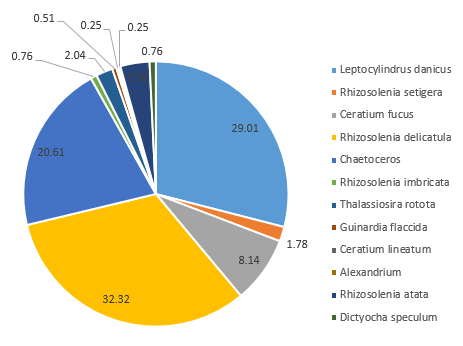
Distinct differences are evident between the phytoplankton communities within the water samples taken from either side of the coastal front. Communities occupying well-mixed water nearer the coast tend to be dominated by diatom groups (Jones and Gowen 1990), as seen in Station 55, where 91% of the zooplankton community consisted of diatom groups such as Rhizosolenia, Chaetoceros and Thalassiosira at 4.8m depth (Figure 5.7).
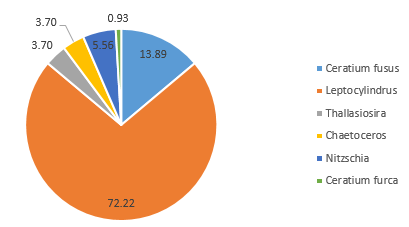
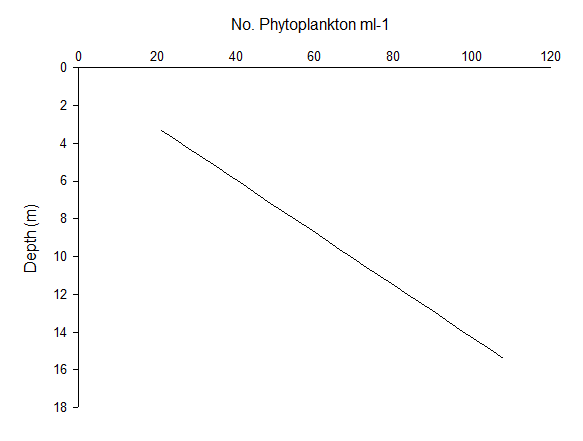
Dinoflagellate species within the community sampled at 15.4m in Station 52 are also outcompeted by diatoms (Figure 5.8), although 14.8% were classified as dinoflagellate species Ceratium sp. (Figure 5.8). This contrasts with the community composition at shallower depth 3.3m, of which 57.1% of the sample consisted of dinoflagellates (Ceratium fusus and Protoperidinium) (Figure 5.9), indicating some stratification.
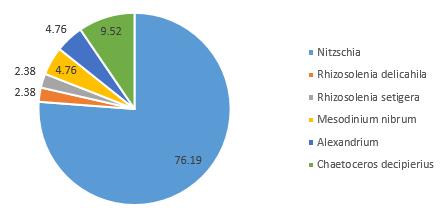
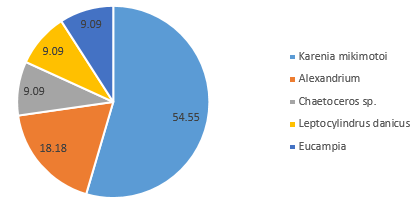
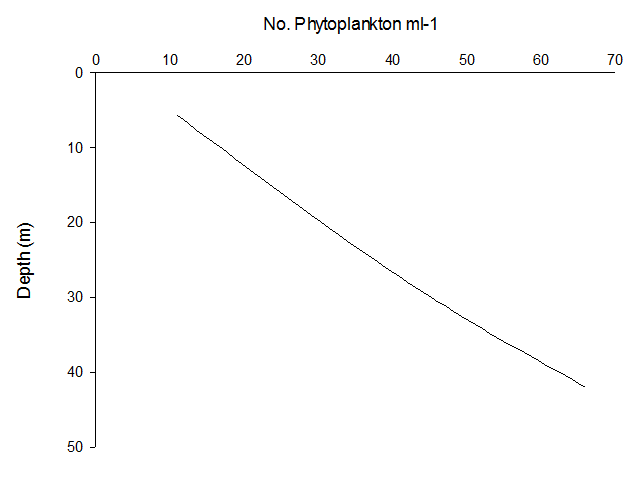
In contrast, the community on the side of the front furthest from the coast (Station 51), where the water column was strongly stratified, was predominantly composed of dinoflagellate groups at depth 42m (60.6%) (Figure 5.10) and 5.7m (72.7%) (Figure 5.12). A further 28.8% of the phytoplankton at depth 42m were identified as ciliates, which possess similar characteristics to dinoflagellates (Lee and Kugrens 1992) (Figure 5.10). However, the sample taken at mid-depth in the same site was observed to be mostly diatoms in the same site revealed higher proportions of diatoms (90.5% of the community), with only 4.8% of the sample identified as dinoflagellates (Figure 5.11). This suggests that competition for dominance between the diatoms and dinoflagellates may also depend on other factors, such as physiological adaptations with respect to growth rates, particularly in areas where irradiance fluctuates (Jones and Gowen 1990).
The difference between diatom and dinoflagellate dominance can be accredited to changes in stratification regarding turbulence and the related nutrient availability (Rodriguez et al. 2001; Li 2002). Hence, stratification with respect to temperature and salinity also have a major impact on phytoplankton community structure dynamics, as thermal stratification determines nutrient supply and the rate at which phytoplankton cells divide (Sverdrup 1953). Dinoflagellate species possess an undulating flagellum, which turns the cells continuously and accelerates water flow over the dinoflagellate, enabling them increase access of nutrient supply and thus dominate stratified, nutrient-depleted water (Margalef 1997; Letterme et al. 2005).
This structural adaptation requires energy investment, and would be redundant in nutrient-rich, turbulent water, where nutrients are well-mixed in the water column; here, non-motile diatoms dominate (Letterme et al. 2005). This explains the dominance of diatoms in sites closer to the shore, and the relatively larger proportion of dinoflagellates on the side of the front furthest from the front. However, only six samples of phytoplankton were taken in total, thus our results may not be deemed a true representation of the phytoplankton community changes over the coastal front.
References
Brunet, C., Brylinkski, J.M. and Frontier, S. (1992) Productivity, photosynthetic pigments and hydrology in the coastal front of the Eastern English Channel, Journal of Plankton Research,Vol 14(11), Pages 1541-1552
Cullen, J. J. (1982). The deep chlorophyll maximum: comparing vertical profiles of chlorophyll a. Canadian Journal of Fisheries and Aquatic Sciences, 39(5), 791-803.
Daro, M. H. (1985). Feeding rhythms and vertical distribution of marine copepods. Bulletin of marine science, 37(2), 487-497.
Davis, A. D., Weatherby, T. M., Hartline, D. K., & Lenz, P. H. (1999). Myelin-like sheaths in copepod axons. Nature, 398(6728), 571-571.
Jones, K. J., & Gowen, R. J. (1990). Influence of stratification and irradiance regime on summer phytoplankton composition in coastal and shelf seas of the British Isles. Estuarine, Coastal and Shelf Science, 30(6), 557-567.
Lee, R. E., & Kugrens, P. (1992). Relationship between the flagellates and the ciliates. Microbiological reviews, 56(4), 529-542.
Leterme, S. C., Edwards, M., Seuront, L., Attrill, M. J., Reid, P. C., & John, A. W. G. (2005). Decadal basin-scale changes in diatoms, dinoflagellates, and phytoplankton color across the North Atlantic. Limnology and Oceanography, 50(4), 1244-1253.
Li, W. K. W. (2002). Macroecological patterns of phytoplankton in the northwestern North Atlantic Ocean. Nature, 419(6903), 154-157.
Margalef, R. (1975). Assessment of the effects on plankton. In Marine pollution and marine waste disposal: proceedings of the 2nd international congress, San Remo, 17-21 December, 1973 (p. 301). Pergamon.
Matsakis, S. (1993). Growth of Clytia spp. hydromedusae (Cnidaria, Thecata): effects of temperature ad food availability. Journal of Experimental Marine Biology and Ecology, 171(1), 107-118.
Rodriguez, J., Tintoré, J., Allen, J. T., Blanco, J. M., Gomis, D., Reul, A., Ruiz, J., Rodriguez, B., Echevarria, F. & Jiménez-Gómez, F. (2001). Mesoscale vertical motion and the size structure of phytoplankton in the ocean. Nature, 410(6826), 360-363.
Sverdrup, H. U. (1953). On conditions for the vernal blooming of phytoplankton. Journal du Conseil, 18(3), 287-295.
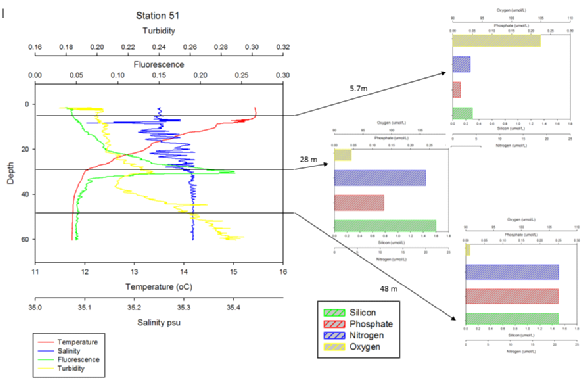
From Figure 5.15 a very clear chlorophyll maximum is observed at approximately 28m at the base of the pycnocline inferred from the coinciding thermocline and halocline. A turbidity spike is observed around the chlorophyll maximum which may be noise from the tests of phytoplankton in the cholorphyll maximum, it may be partially down to mixing between layers at the base of the pycnocline. A nutrient drop is not observed with the chlorophyll maximum however a sharp drop in oxygen below 100% saturation is observed with depth. This implies that there is an increase in microbial activity explaining the lack of a nutrient drop at the chlorophyll maximum as the microbial activity remineralises the nutrients.
Click images to enlarge
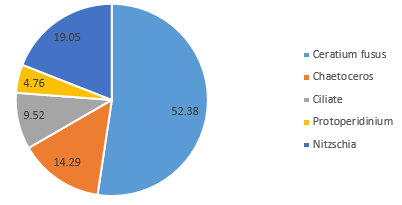
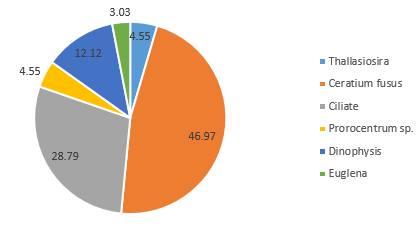
Dinoflagellate species within the community sampled at 15.4m in Station 52 are also outcompeted by diatoms (Figure 5.10), although 14.8% were classified as dinoflagellate species Ceratium sp. (Figure 5.10). This contrasts with the community composition at shallower depth 3.3m, of which 57.1% of the sample consisted of dinoflagellates (Ceratium fusus and Protoperidinium) (Figure 5.11), indicating some stratification.
Phytoplankton abundance appear to increase linearly with depth at Station 51 (Figure 5.13) and 52 (Figure 5.14); this elevated phytoplankton biomass is a typical characteristic of a Deep Chlorophyll Maximum (DCM), as well as a key feature of the zooplankton environment in coastal areas where seasonal stratification develops. Thus, the interactions between phytoplankton abundance and chlorophyll concentrations in depth profiles can aid the understanding of the relationship between zooplankton and the DCM (Cullen 1982). Upon repeat of this study, it is recommended that a depth profile of zooplankton biomass be sampled in order to reach conclusions on this association.
Biochemical
Chlorophyll
Method
50ml of water samples were extracted from the Niskin bottle attached to the CTD rosette, each time the Niskin bottle was deployed. It is worth noting that the Niskin bottle was fired at a different number of depths per station (samples were collected at three depths at Station 51, two depths at 52, and only once at Station 55), where appropriate with each individual site. No water samples were taken from either Station 53, due to the fact that no chlorophyll maxima was visible, or Station 54 (as the team members working in the laboratory were still too busy for more samples to be taken on). Samples were processed and analysed for chlorophyll concentration according to the methodology in the literature (Parsons et al. 1984).
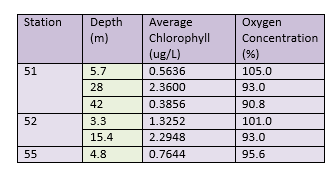
Another representation of the chlorophyll and dissolved oxygen data collected can be seen in Table 1.
All stations that were sampled had high levels of oxygen at the surface. This could be due to wind mixing, oxygenating the surface waters. Surface oxygen concentrations were highest at the most offshore station (51), where the waters were stratified. Low chlorophyll concentrations at the surface (5.7m) mean that low amounts of oxygen were being taken up for biological respiration by predating zooplankton. The concentrations of DO decreased with depth however, while chlorophyll increased with depth to 28m, showing a chlorophyll maxima. The decreased DO is likely due to biological utilisation by zooplankton, respiring while they graze on phytoplankton. Chlorophyll levels decline below the maxima , as light intensity decreases exponentially with depth, preventing photosynthesis from occurring. DO concentrations further decreased at 42m depth, as below the chlorophyll maxima (which also signals the thermocline ~27m), water does not undergo wind mixing during the summer months.
Station 52 gives a representation of chlorophyll and DO at the tidal front. Due to more favourable conditions here (ie cool waters and high nutrients), surface (3.3m depth) chlorophyll levels are high but also increase with depth, where higher levels of nutrients are available. This was reflected in the DO concentrations, as the surface DO concentration was lower than at station 51, but again decreased with depth. However, this increase in chlorophyll could be due to accumulation of phytoplankton caused by convergence at the front as opposed to increased primary production (Brunet et al, 1992).
Station 55 represents a well-mixed water column, and because of this surface chlorophyll levels were higher than the surface concentrations at the most stratified station. The dissolved oxygen concentration reflected this, and was lower than the other two station's surface values due to increased biological activity, again likely due to an increase in zooplankton, caused by an abundance of phytoplankton.
| Chemical |
| Biological |
| Physical |
| Biochemical |
| Physical |