
Phytoplankton
Method
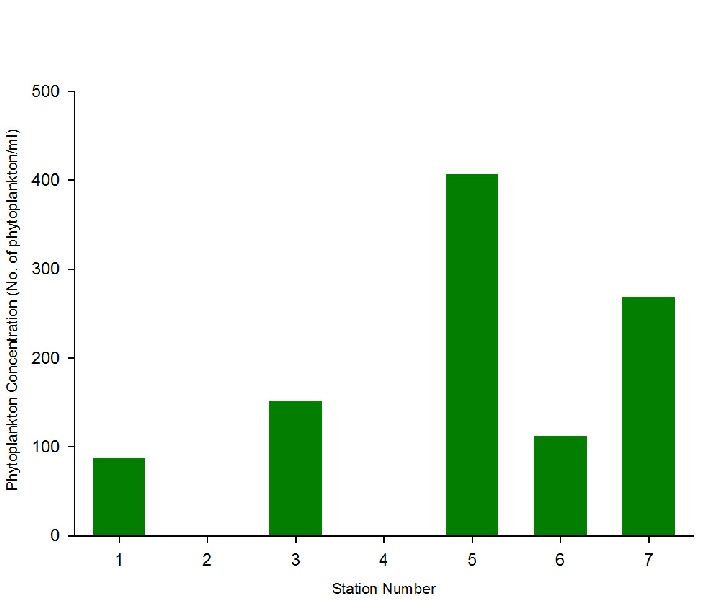
100ml water samples were collected from the Niskin bottle for analysis of phytoplankton communities at Stations 1,3,5,6 and 7. Samples were examined through a light microscope; these counts were used to give an estimation of the number of phytoplankton per m³ at different sites within the estuary.
Zooplankton
Method
A plankton net (mesh size 200µm, diameter 0.5m) was trawled for 5 minutes at Stations 1, 3 and 7 in order to extract 1 litre water samples, later examined for zooplankton community structure. Samples were examined through a light microscope; these counts were used to give an estimation of the number of zooplankton per m³ at different sites within the estuary.
Biological properties of the Fal
Chlorophyll
Method
50 ml of estuarine water samples were collected from the Niskin bottle each time it was deployed, and samples were processed and analysed for chlorophyll concentration according to the methodology in the literature (Parsons et al. 1984). We also collected chlorophyll concentrations using a CTD.
Discussion
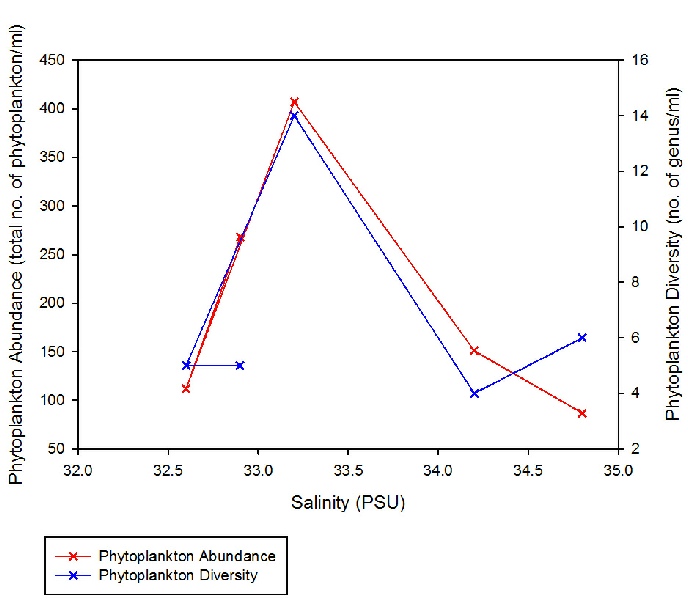
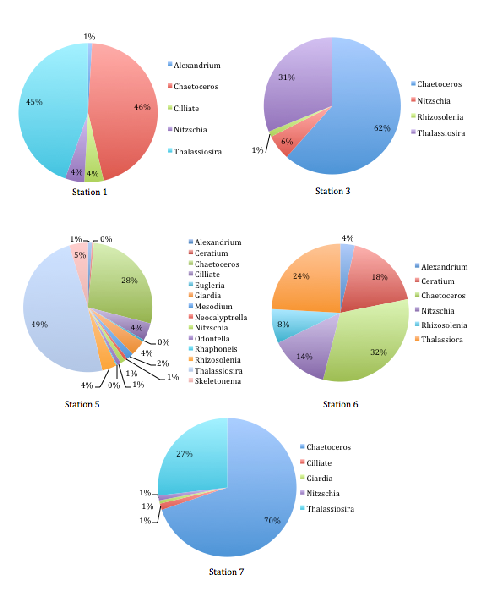
As phytoplankton are predominantly marine organisms, fewer species are able to tolerate the low salinities found further away from the estuary mouth; only more euryhaline species remain (Figure 3.17. Due to a higher tolerance of most estuarine conditions, diatoms were able to outcompete other species, hence the consistent diatom dominance. The overall range in phytoplankton abundance varied from 87 to 406 cells per ml water, with diversity ranging from 4 to 10 plankton taxonomic groups observed (Figure 3.18; Figure 3.19). The low diversity within phytoplankton communities can also be explained by the fact that blooms are controlled by abiotic conditions such as nutrients and light intensity; blooms are thus seasonal and the community structure will change throughout the year, depending on which phytoplankton groups is most suitably adapted to the conditions at that time. The samples collected were few, and at a single point in one season; thus there was a limited scope for analysis.
Station 1, nearest to the mouth of the estuary, was predominantly comprised of various diatom species (78% diatoms). The largest group of these, and indeed the largest in the whole phytoplankton community of Station 1, was Chaetoceros (32%)(Figure 3.17).
Other major diatom groups included Thalassiora, Nitzchia, and Rhizosolenia. The remaining 22% of the phytoplankton community consisted of dinoflagellate groups (mostly Ceratium, but a small proportion of Alexandrium was recorded too). As the salinity increased from 34.8 (Station 1) to 34.2 (Station 3), the sample was found to be wholly comprised of diatom groups (Figure 3.17).
These were the same major diatom taxonomic groups seen in Station 1, though proportionally different. Chaetoceros, again the most abundant phytoplankton genus within the sample (62%), and Thalassiosira, the next largest community component (31%), vastly outcompeted Rhizosolenia and Nitzschia (Figure 3.17).
It is interesting that the trends for phytoplankton abundance and diversity seen at Station 5 appeared to have a much higher diversity in terms of phytoplankton community composition, although it was again dominated by diatoms (89%)(Figure 3.17).
However, Thalassiosira was the major diatom genus seen (49%), followed by Chaetoceros (28%) (Figure 1c). The remaining community included very small proportions of dinoflagellates (1%), flagellate Giardia (4%), and some ciliates (4%)(Figure 3.17).
Diatoms were the predominant phytoplankton group seen in Station 6, with equal proportions of Thalassiosira and Chaetoceros (45% and 46%, respectively), and very few dinoflagellates (1%) and ciliates (4%) observed. Station 7 showed a similar trend, with an even more pronounced dominance of diatoms (98%), and Chaetoceros making up the proportionally largest group yet (70%)(Figure 3.17).
The trends for phytoplankton abundance and diversity seem concomitant as the salinity changes over the course of the estuary (with the exception of the period between Station 1 and 3, where the decrease in salinity from 34.8 to 34.2 is accompanied by a small increase in abundance and decrease in diversity) (Figure 3.18; Figure 3.19). Both community characteristics appear to reach a peak at Station 5 (salinity 33.2), before declining as salinity decreases further, though admittedly at different rates (Figure 3.18).
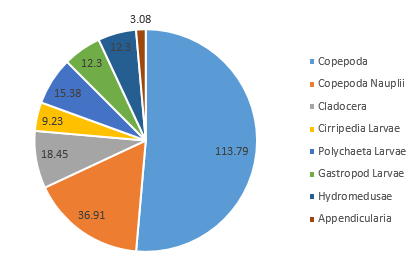
Our results showed Copepoda as the clear dominant group in Station 1, accounting for 51.4% of the species recorded in the sample (in addition to a further 16.7% of the species identified as Copepoda nauplii) (Figure 3.20). The sample also showed similar abundances for Cirripedia larvae, Polychaeta larvae, astropoda larvae, and Hydromedusae (all between 8.3% and 4.2%) (Figure 3.2).
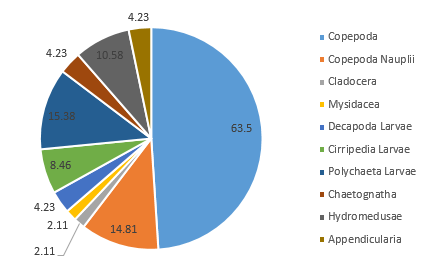
At Station 3, Copepoda and Copepoda nauplii could still be identified as the major groups, seen in similar proportions (together comprising 60.4% of the zooplankton community), and with the next largest species group recorded as Polychaeta larvae (Figure 3.21). A slightly higher diversity than at Station 1 is also seen; more zooplankton species groups were identified in the sample from Station 3 (Mysidacea, Decapoda larvae and Chaetognatha) (Figure 3.2; Figure 3.21). Gastropod larvae, which constituted 8.3% of the community in Station 1, is absent from the sample in Station 3 (Figure 3.21).
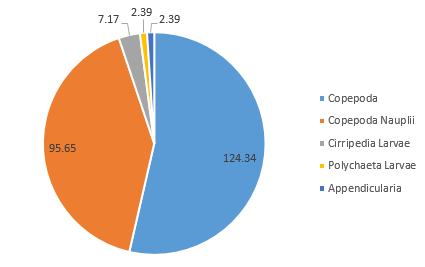
The zooplankton community is comparatively very low in diversity; only five zooplankton species groups were recorded (Figure 3.21; Figure 3.22). The proportion of Copepoda was found to almost identical to that of Station 1 (53.6%); however, there was a vast increase in the proportion of the community noted as Copepoda nauplii (41.2%) (Figure 3.22). Appendicularia, Cirripedia larvae, and Polychaeta larvae formed the remaining 5.15% of the community (Figure 3.22).
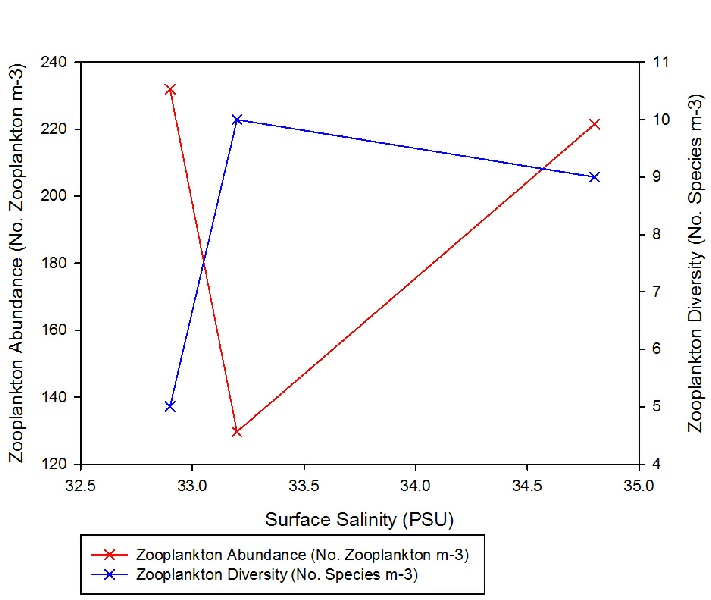
Zooplankton species diversity was shown to increase slightly as salinity declined from 34.8 to 33.2; however, the decrease in salinity between Station 3 and 7 (from salinity 33.2 to 32.9) accompanied a large decline diversity (Figure 3.23). Though the lowest diversity was seen in Station 3, the highest abundance of zooplankton (231.94 zooplankton m-3) was also found in the same sample (Figure 2). This was 102.3 zooplankton m-3 higher than in the sample from Station 2 (where the highest diversity of species was observed) (Figure 3.23).
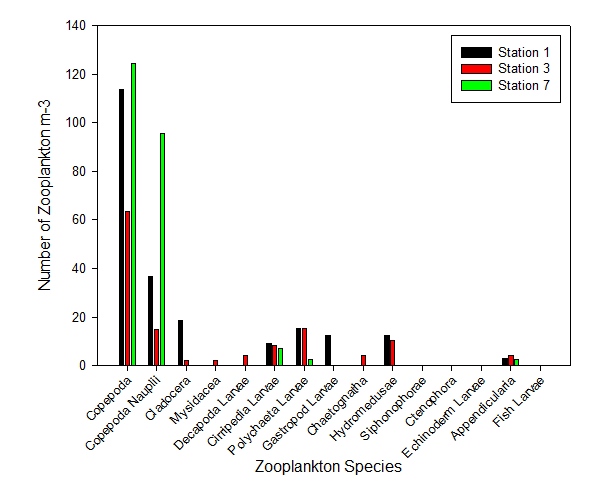
Zooplankton group Copepoda (together with the nauplii of the same species) seem to out compete all other species at this site (Figure 3.24). As salinity increases from 33.2 to 34.8, the abundance of zooplankton likewise increases once more (by 91.8 zooplankton m-3) (Figure 3.23). Nevertheless, it must be noted only three samples were collected for zooplankton community analysis, thus the results may be not a true representation of the community structure across the entire estuary. Furthermore, zooplankton communities are known to be rather erratic, governed by the food supply at that time. As zooplankton are consumers, the available food supply may be reflecting the levels of diversity resulting in the estuary.
Discussion
Although the data does not show a high zooplankton abundance coinciding with a similarly high phytoplankton one, the two peaks in diversity for the plankton species do concur (Figure 3.23). The zooplankton are able to take advantage of the increase in phytoplankton food source availability, hence the increase in zooplankton diversity. As the phytoplankton abundance and diversity decreases with increasing salinity, food availability is limited; thus, only more tolerant species such as diatoms are able to out-compete the others. Some larval species, copepod larvae especially, appear to constitute a rather large proportion of the population, indicating use of estuarine waters as nurseries by some zooplankton species, and an abundance of phytoplankton as a food supply encouraging the reproductive stage within the zooplankton life cycle.
Results and Discussion
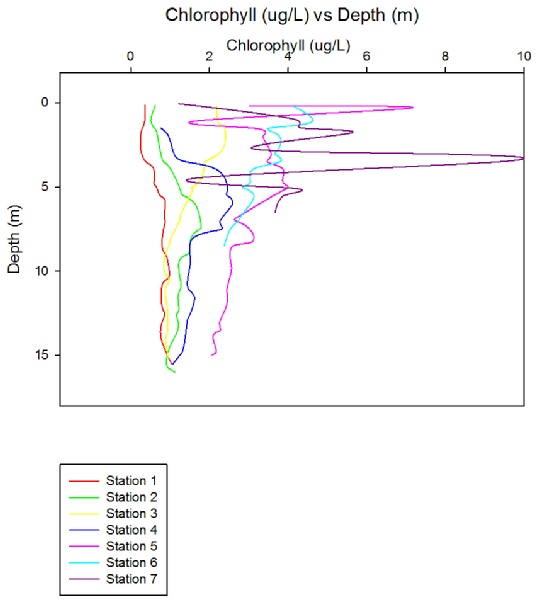
Chlorophyll concentration increased dramatically when travelling up the estuary into fresher waters, as shown in Figure (3.26). The most likely explanation for this is increased nutrient concentrations upstream, as nutrients vital for phytoplankton growth tend to be higher in riverine waters due to both natural and anthropogenic causes. Agriculture is one of the main modern inputs of nutrients to estuarine systems, with the type of agriculture thus determining the levels of nutrients.
The farmland surrounding the Fal tends to be a mixture of pasture and arable land (Cornwall Council), meaning that large amounts of nutrients that enter the rivers feeding the Fal Estuary are likely to be of anthropogenic origin, in the form of fertilisers and pesticides. Estuaries, such as the Fal, which are influenced mainly by tidal forcing with a low river input also tend to have much higher concentrations of nutrients compared to offshore waters (Balls, 1994).
When examining Figure 3.26, a very regular trend of decrease in chlorophyll concentration with occurs for each station, bar station 3, which shows a slight increase in concentration with depth after 10m. The reason for the general decrease is most likely due to changes in the light intensity, as light attenuates rapidly through water, especially when other factors such as turbidity increase. Light can be seen to have the largest effect on phytoplankton growth and has received the largest amount of attention in literature (Peterson et al, 1985), thus impacting the levels of chlorophyll, but nutrient availability also plays a large role, particularly in estuarine systems.
When travelling up river towards station 7, the levels of surface chlorophyll increase despite higher levels of turbidity. This is probably due to the increase in levels of vital nutrients such as nitrate and phosphate, which, as already mentioned, tend to originate from land. Although only a few depths were sampled at each station, the profiles generated support that in this system nutrients play a large role in the concentration of chlorophyll.
Introduction
Marine and estuarine phytoplankton are photosynthetic autotrophs, responsible for fixing greater than 50% of global organic carbon and producing one fifth of atmospheric oxygen (Leblanc et al, 2012). As a result of their shear abundance and complex biological processes, phytoplankton have major ecological significance in terms of the food chain and major nutrient cycles. It is therefore of key importance to develop an understanding of the distribution of phytoplankton species, particularly in estuarine environments which can be extremely varied in their physical and chemical properties. As well as taking water samples to visually count phytoplankton concentration, it is possible to calculate the phytoplankton concentration through the detection of chlorophyll in a given sample. Zooplankton on the other hand are heterotrophic plankton, and although they are primarily transported by physical forces such as tides, many species do have limited control over locomotion and their position in the water column. Zooplankton graze on phytoplankton and other zooplankton, they are therefore generally found in the surface euphotic zone, where food resources are copious.
Click images to enlarge
| Chemical |
| Biological |
| Physical |
| Biochemical |
| Physical |