
Introduction
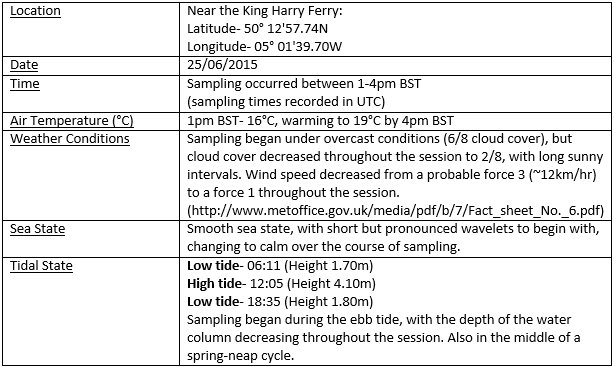
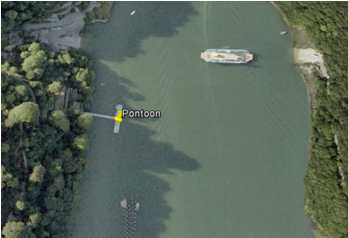
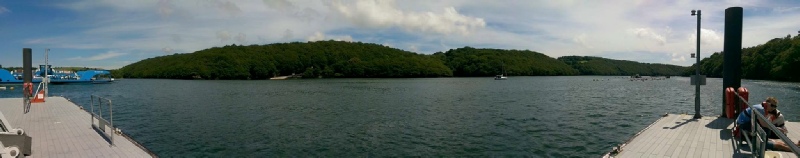
The principal aim of the study period was to measure multiple variables over the course of three hours, in order to create a time series documenting change in this area of the Fal Estuary system. All features analysed at this station (Figure 4.1) were measured at thirty minute intervals; thus, a time series could be generated from data collected at seven points during the sampling period. YSI multiprobe was used to monitor various parameters at 1m depth intervals throughout the water column.
A flow meter lowered in order to measure the speed and angle of flow, again at 1m depth intervals. A surface sample of estuarine water was collected and filtered using a syringe, trapping any phytoplankton onto a piece of filter paper (later analysed in the laboratory for chlorophyll concentration). Finally, light intensity was measured at meter increments, so as to monitor the changing behaviour of light, due to parameters such as varying turbidity. These changes were caused by differences in tidal flow as the day progressed.
The falling tide resulted in a gradual decrease in maximum water depth over the course of afternoon. This was taken into account at each time of data collection, with the maximum depth deduced using the light sensor before any other sampling began.
Flow - Results and discussion
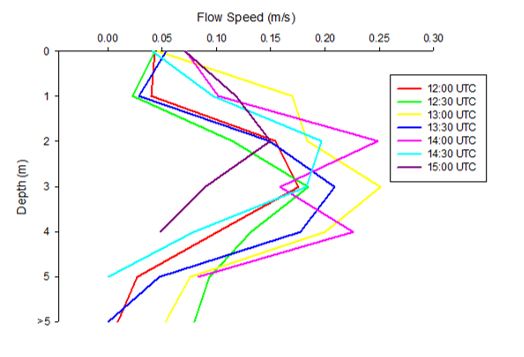
In order to monitor the fluctuations in flow speed (in ms-1) and direction (in degrees) caused by the changing tide, a flow meter was lowered into the water column. Values were recorded at the surface, and then at subsequent 1m intervals with depth. These readings were used to generate plots outlining the variations in flow over the duration of the sampling period.
The flow speed is seen to change with both depth and time (Figure 4.4). As sampling occurred after high tide (12:05pm BST, 11:05am UTC), water was being flushed out of the estuary via the ebb tide during the period of data collection. This feature can be seen on Figure 4.5, where it can be shown that flow speed increases dramatically with depth for each sampling, indicating the retreating tide. The characteristic is most distinct at 13:30 UTC, which exhibited the largest difference in flow speed of 0.209ms-1 (between maximum and minimum fvalues).
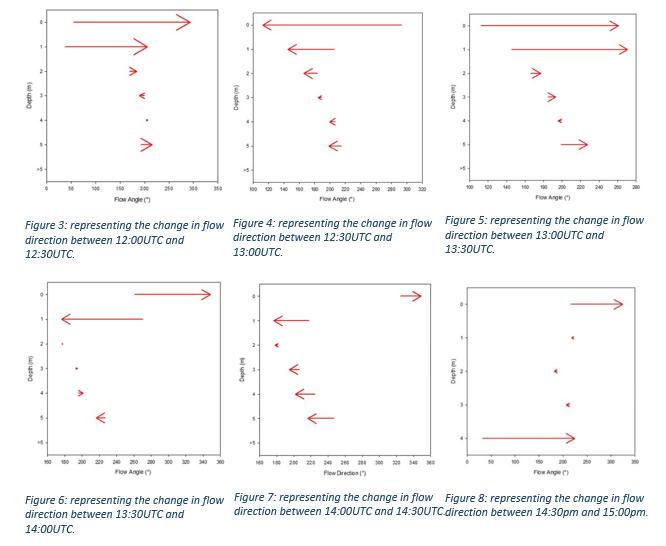
The difference in flow direction could also be calculated from the angle readings provided by the flow meter. Figures 4.5 represents the differences in flow direction over thirty minute periods between 12:00UTC and 15:00UTC. A larger negative flow would be expected to be visible over time, as a result of the ebb tide acting as the dominant tidal force in the site.
However, most of the flow directions are very erratic and do not follow the predicted pattern, with the exception of Sub-figures 3 and 7 (which do exhibit increased negative flow). The lack of homogeneity in our results could be explained by the fact that the Fal Estuary does not experience very high riverine input, with tides playing the major role in the transport of water through the system. Wind forcing could also have affected the flow direction, particularly at the surface. This may explain the results seen in Sub-figures 5 and 6.
YSI - Introduction
A YSI multiprobe was utilised to record the temperature (°C) and salinity (PSU) at each depth interval throughout the sampling session, as well as dissolved oxygen (% saturation), chlorophyll (µg/L), pH and turbidity. These were monitored by deploying the sensor into the water column, taking measurements at the surface, and subsequently at every 1m depth in the water column.
Temperature - Results and Discussion
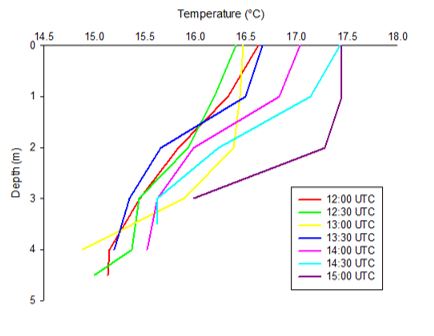
The temperature profiles of the water column changed dramatically, due to both the time of day and the time of year. Figure 4.6 shows that during the three hours of the sampling period, the temperature of virtually the entire water column increased by over a degree Celsius. The temperature profile exhibiting the most dramatic range in values occurred at 15:00 UTC, with a difference in temperature of 1.46°C from the surface to the bed.
Salinity - Results and Discussion
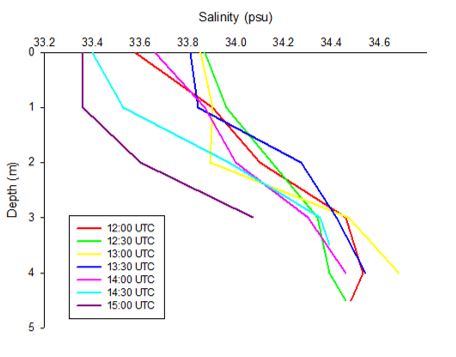
The state of the tide had a large influence on the salinity profiles collected at the pontoon. While all times sampled show that salinity increases with depth (Figure 4.7), there was an overall decrease in surface salinity decreased over the time series, reaching 33.35 PSU at the last time of sampling. This reflected the influences of the ebb tide and increased freshwater input in the estuary.
Chlorophyll - Results and Discussion
Chlorophyll concentration was monitored using the YSI probe, and, in addition, samples were obtained from the surface waters in order to perform later laboratory analysis of chlorophyll concentration using a fluorometer. These samples were collected every thirty minutes and filtered in order to trap any present phytoplankton onto a piece of filter paper; this was then placed in acetone to remove the chlorophyll from the phytoplankton cells.
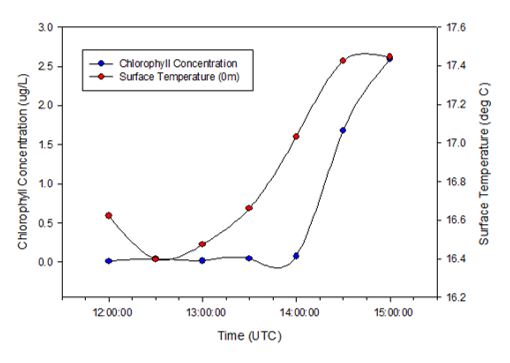
Figure 4.9 displays the chlorophyll data collected, along with a time series of surface temperature. Interestingly, it can be seen that chlorophyll increases throughout the afternoon reaching its highest value at the last time sampled: 2.592µg/L at 15:00 UTC. This is most likely due to the increase in temperature (also plotted), which enhanced primary production.
Irradiance - Results and Discussion
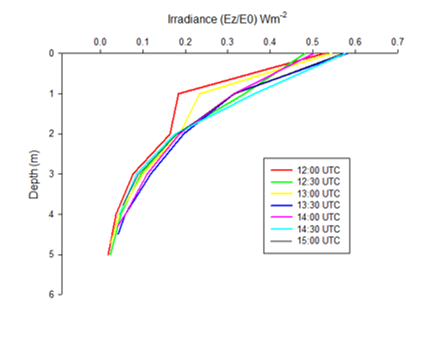
Finally, irradiance was measured throughout the water column by obtaining a ratio of surface light intensity to light intensity at depth. Figure 4.10 depicts the change of irradiance throughout the water column over the course of the sampling period. However, it can be seen that there was very little change in the attenuation of irradiance with depth over the course of the afternoon. The only exception to this trend was seen at the first sampling time (12:00 UTC), which shows a more rapid decrease in irradiance in the first metre than any other time sampled.
PONTOON
References
Grasshoff, K., Kremling,K., & Ehrhadt, M. (1999). Methods of seawater Analysis, 3rd Edition Wiley- VCH.
Click images to enlarge
| Chemical |
| Biological |
| Physical |
| Biochemical |
| Physical |