


University of Southampton 2015©


CHEMICAL ANALYSIS

GO TO:

SAMPLING:
All nutrients were collected by Niskin bottles on a CTD rosette deployed to three depths at each station (top, middle and bottom of the water column). Due to two bottles misfiring, there is no nutrient data at station 9; therefore measurements were taken at the same geographical region, resulting in repeated CTD measurements (station 9 and 10) and nutrient samples (station 10).


SAMPLE STORAGE AND LABORATORY ANALYSIS:
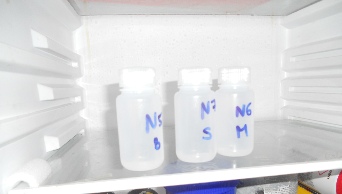
After sampling, nitrate samples were stored in labelled brown glass bottles, and the following day these samples were analysed in the laboratory to obtain numerical values for nitrate concentration.

Depth profile (Figure 1):
It is clear from the depth profile that the highest concentrations of nitrate occur at Station 8, situated furthest up the estuary near the mouth of the Truro River, and therefore likely due to anthropogenic inputs via the Truro. At Station A, the nitrate concentrations range from 19.34umol-1 at the surface to 8.75umol-1 at a depth of 2.52m, increasing slightly at 4.21m to 12.65umol-1. The significant drop in concentration at the middle depth of station A coincides with a chlorophyll maxima measured by the CTD. This suggests that the greatest uptake of nitrate by phytoplankton occurs around 2 – 3m (this can also be seen clearly at station 10). Moving down the estuary, the concentrations at each station drop considerably compared to Station 8 and all cluster between 7.63umol-1 and 2.67umol-1, with less variation in concentration at depth. However, nitrate concentrations are marginally higher in the deepest sample compared to the surface measurements at stations 10-15. This suggests that riverine input is the main source of nitrate into the estuary, where mixing occurs, resulting in similar profiles at subsequent stations (10-15).

RESULTS:

Mixing diagram (Figure 2):
The concentration of nitrate is highest in the fresh water of the river, at station 8, where the salinity is at its lowest. Station 8 exhibits a salinity of 32.1 and a corresponding nitrate concentration of 19.4473 umol-1. The lowest nitrate concentrations are found in water with a salinity over 35; the lowest concentration of 2.7637 umol-1 occurs at a salinity of 35.11 at station F. The riverine end member concentration is much higher than the ocean end member, which is common due to the input of nutrients from the Truro River. The data points fall just below the theoretical dilution line, so it can be concluded that nitrate concentration shows evidence of slight non-conservative behaviour, with nitrate being stripped from the water column. This behaviour is most likely due to the biological uptake of the nutrients within the water column.

Figure 2 - Mixing diagram for nitrate, including end members
(Click to expand)

SAMPLE STORAGE AND LABORATORY ANALYSIS:
Following sampling, silicate samples were stored in labelled plastic bottles, ready for analysis in the laboratory, where values for concentration were attained. Due to a dilution error, the recorded silicon end member sample could not be analysed with the rest of the data, so it was replaced with data collected by group 8 on the 26th of June 2015.

RESULTS:

Depth profile (Figure 3):
Following the same trend as nitrate, silicate concentrations are again highest at the riverine end of the estuary. This is likely caused by the flux of nutrient input by the rivers, especially the Truro river, since it is larger. The highest silicate concentration of 4.85 umol-1 was found at 4.35m at station 8. Again, silicate decreases as you move down the estuary, with the lowest values occurring at stations 14 and 15; values lying between 1.26 umol-1 and 1.61 umol-1.The decrease in silicon coincides with the depth at which nitrate uptake is present. Therefore, the nitrate and silicate are likely to be being utilised by diatoms in the surface waters.

Mixing diagram (Figure 4):
The concentration of silicate is higher in the fresh water of the river at station 8. Station 8 exhibits a salinity of 32.4 and a corresponding silicate concentration of 4.877 umol-1. The lowest silicate concentrations are found in water with salinity over 35; the lowest concentration of 1.262 umol-1 occurs at a salinity of 35.11 at station 14. Similarly to nitrate, silicate displays non-conservative behaviour; the points lying below the theoretical dilution line represent this.
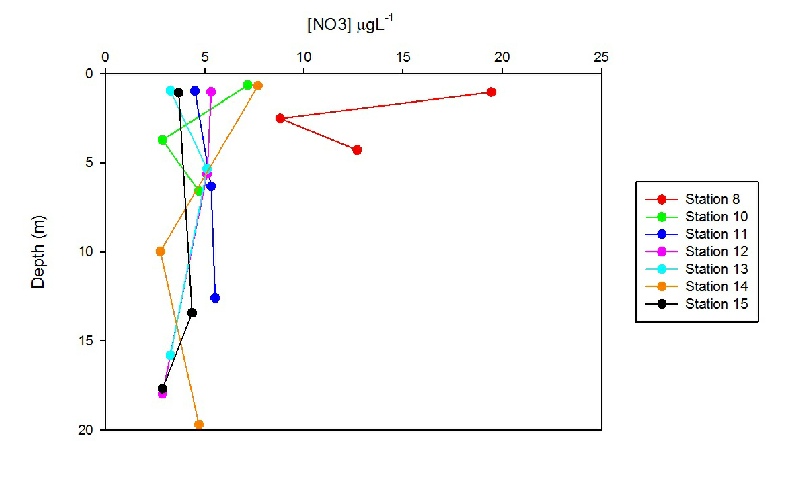

Figure 1 - Depth profiles for nitrate at each station.
(Click to expand)

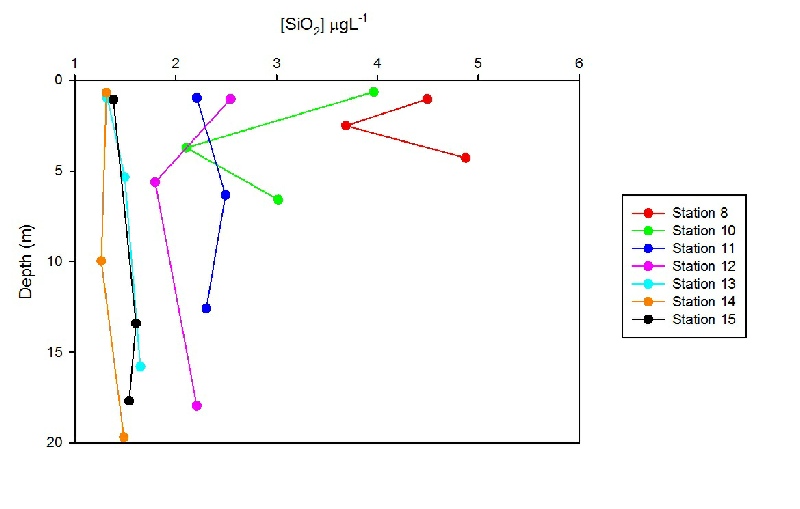
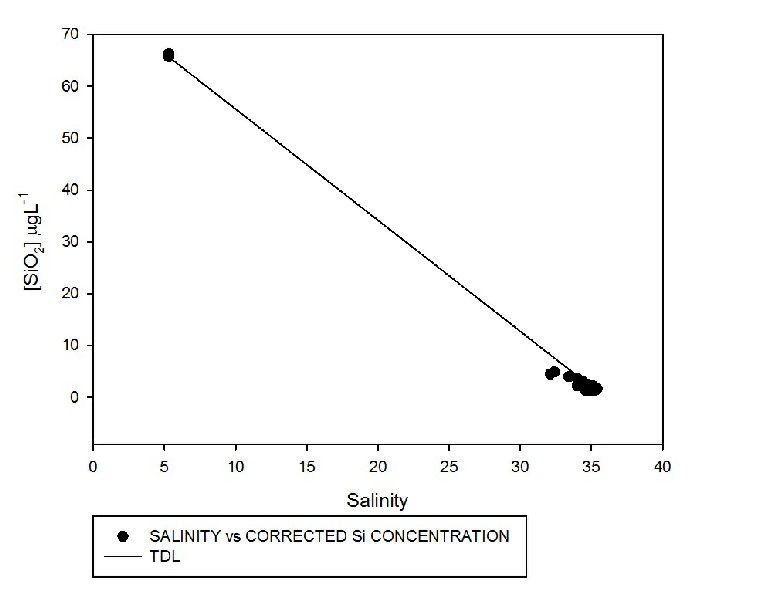

Figure 4 - Mixing diagram for silicate, including end members
(Click to expand)

Figure 3 - Depth profiles for silicate at each station.
(Click to expand)

SAMPLE STORAGE AND LABORATORY ANALYSIS:
Immediately after samples were obtained, oxygen samples were put into glass bottles, and treated with 1ml of manganous chloride followed by 1ml of alkaline iodide solution, before being analysed to obtain numerical values the next day.

Depth profile (Figure 7):
Figure 7 shows, with the exception of station 15, that the percentage oxygen concentration is highest at the surface and drops with depth, most considerably at station 8 and 14. The surface levels of the estuary are supersaturated, with saturation decreasing as you move away from the Truro River; station 15 is the only station where the surface is not supersaturated. Station 14 has both the highest surface oxygen concentration (141%), and the largest range (~50%). Station 15 has the lowest surface concentration of 99.5%, but increases slightly to 101.5%.

Mixing diagram (Figure 8):
Oxygen percentage concentration is higher in the fresh water of the river at station A. Station 8 exhibits a salinity of 32.1 and a corresponding oxygen concentration of 133 %. The lowest oxygen concentrations are found in water with salinity over 35. The lowest concentration of 92.9% occurs at a salinity of 35.1 at station 12. Oxygen appears to behave conservatively in the estuary with points following the theoretical dilution line. However, there appear to be two outliers either side of the TDL.
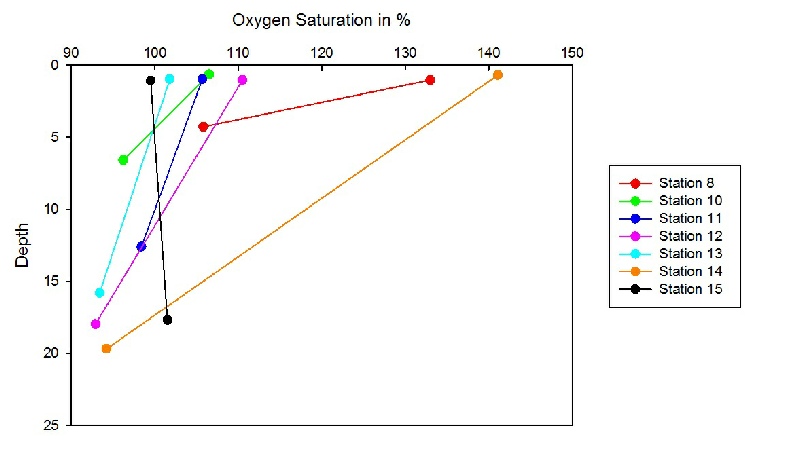

Figure 7 - Depth profile for dissolved oxygen at each station.
(Click to expand)
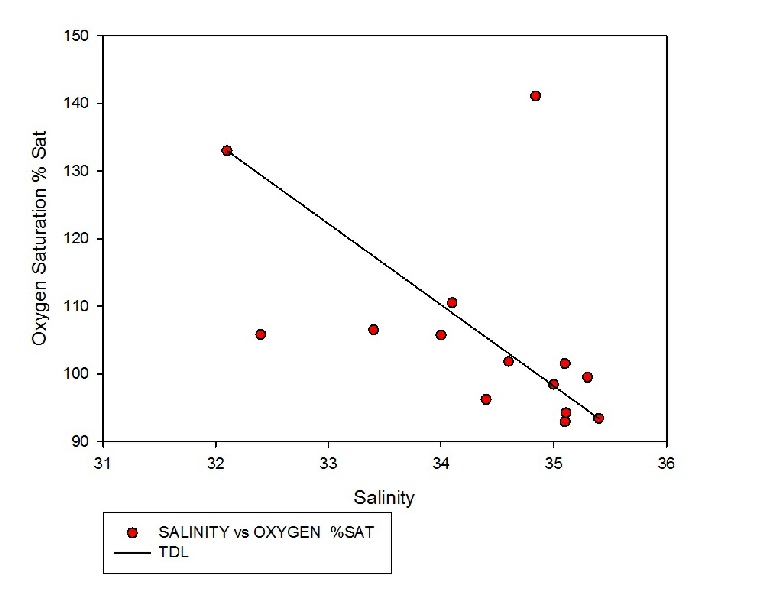
Figure 8 - Mixing profile for dissolved oxygen, including end members.
(Click to expand)

SAMPLE STORAGE AND LABORATORY ANALYSIS:
Numbered brown glass bottles were used to store phosphate samples, until they could be analysed in the laboratory and concentration data could be deduced.

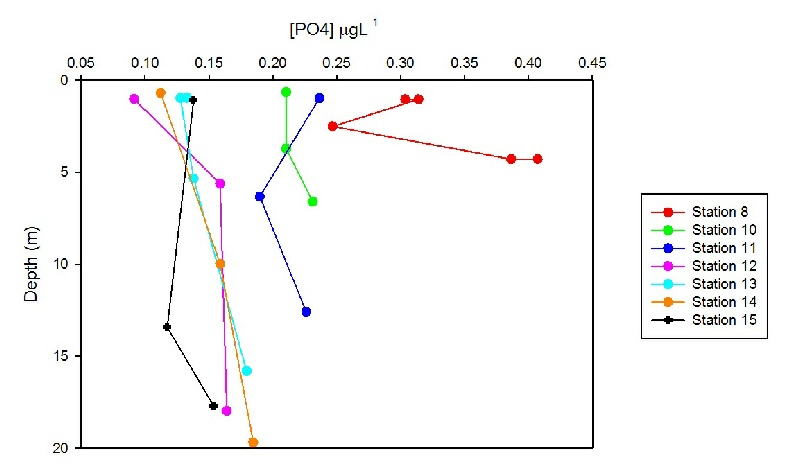
Depth profile (Figure 5):
Similarly to nitrate and silicate, the concentrations of phosphate are highest at Station 8, with a surface value (0.99m) of 0.31 umol-1, increasing to 0.41 at 4.33m. There is considerably less overlap for the subsequent stations’ phosphate concentrations, compared to that of the nitrate concentrations. At every station (besides Station 11), the concentrations of phosphate are lower at the surface than at depth, suggesting the largest amount of biological uptake occurs near the surface of the water column. The lowest phosphate concentration of 0.09 umol-1 occurs at the surface (1.05m) of station D, However, at 18.10m it increases to 0.16 umol-1.

Mixing diagram (Figure 6):
The concentration of silicate is higher in the fresh water of the river at station 8. Station 8 exhibits a salinity of 32.4 and a corresponding silicate concentration of 4.877 umol-1. The lowest silicate concentrations are found in water with salinity over 35; the lowest concentration of 1.262 umol-1 occurs at a salinity of 35.11 at station 14. Similarly to nitrate, silicate displays non-conservative behaviour; the points lying below the theoretical dilution line represent this.

Figure 5 -Depth profiles for phosphate at each station.
(Click to expand)
Figure 6 - Mixing diagram for phosphate, including end members
(Click to expand)

RESULTS:
RESULTS:

CTD data (Figure 9):
The CTD data shows that the estuary is supersaturated with oxygen. Oxygen does decrease with depth. By comparing oxygen saturation with the chlorophyll data, the higher the concentration of chlorophyll the higher the saturation of oxygen. The surface waters contain a higher saturation of oxygen due to the phytoplankton existing more in the surface than the deeper waters. Station 8 shows the highest saturation of oxygen at 1m depth and a saturation of 119.5%.
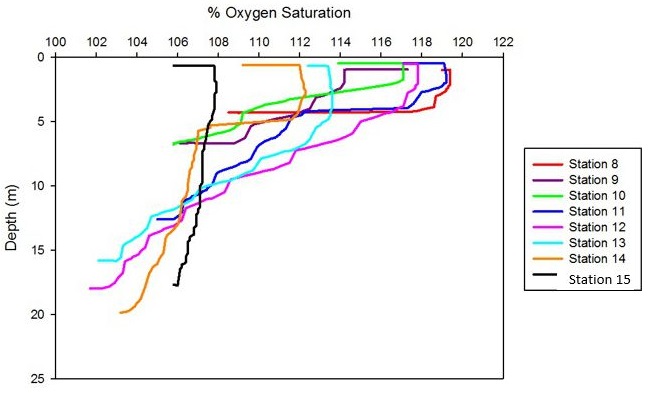

Figure 9 - Depth profile for dissolved oxygen at each station, from the CTD data
(Click to expand)

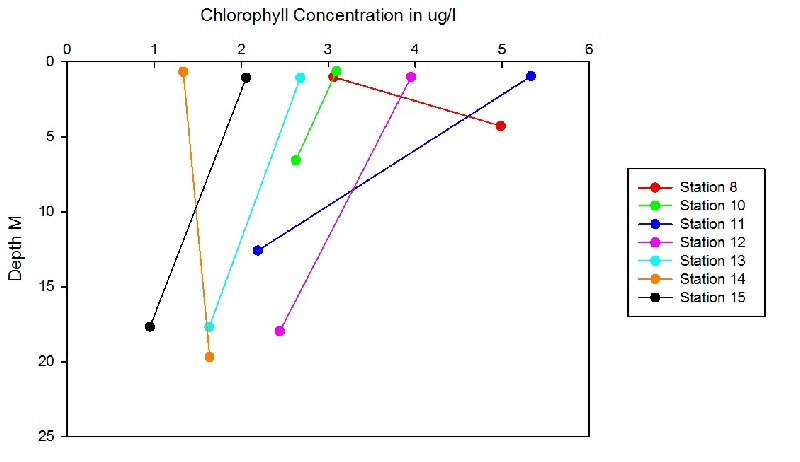
Figure 10 - Depth profile for chlorophyll at each station
(Click to expand)


This graph (Figure 10) shows the surface and bottom concentrations of chlorophyll against depth at the 7 sampling stations where chlorophyll was sampled along the estuary.
The lowest chlorophyll levels in the surface were found at station 14 at 1.3ug/L, with the highest at station 11 at 5.2ug/L. The highest bottom level of chlorophyll was found at station 8 at 5ug/L.
Station 11 had the largest range of data between the surface and the bottom having a difference of 3.1 ug/L. Station 10 had the smallest range of 0.3ug/L
In general, surface concentrations are higher than bottom concentrations (with the exception of station 14 and station 8). This is very likely because light intensity is higher at the surface, and there is therefore more biological activity in this part of the water column.

SAMPLING AND LABORATORY ANALYSIS:
Values were calculated in the lab by measuring light transmission through the water samples after adding a reagent. These value were then compared to standards in which the chlorophyll values were known.
Chlorophyll is then used as a proxy for the amount for the amount of photosynthetic potential in the water column.
RESULTS:

CTD data (Figure 11):
Chlorophyll concentrations decrease from the station furthest up the river to the seaward station from 4µg/L to 0.5µg/L. The large fluctuations in station 8 data may be due to an error in our results rather than a chlorophyll maximum as the water is very shallow and will have a high input of organic material from the rivers.
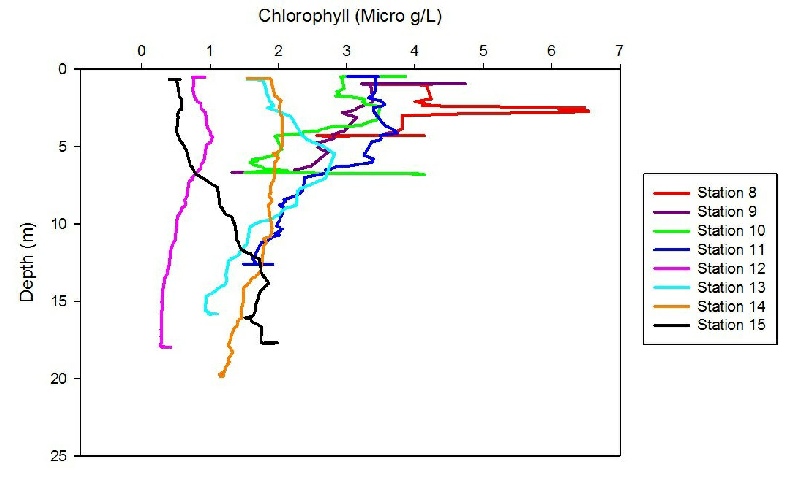

Figure 11 - Depth profile for chlorophyll at each station, from the CTD data
(Click to expand)