


University of Southampton 2015©


BIOLOGICAL ANALYSIS


SAMPLING AND LABORATORY ANALYSIS:
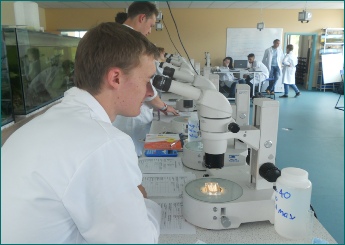
Phytoplankton were sampled by taking water from
the surface niskin bottle on the CTD and were stored in preservatives. A settling
liquid was added to 100ml of sampled water and left over night. 10ml of settled sampled
water was then taken from each station and species identification and abundance count
were assessed through a microscope. 1 ml of settled sample was placed on a Wildco
Sedgewick-rafter counting cell where 5 rows of 20 cells were counted. Since the sample
was diluted by a factor of 10, only a 10th of the rafter can be counted.


SAMPLING: AND LABORATORY ANALYSIS:
The samples here referred to (Figures 8-10) were collected at three stations in the Fal estuary, using a zooplankton tow net (0.5m diameter, 200µm mesh size). The three stations were chosen for sampling as their locations allow for a good overview of how freshwater input (highest at station 8, lowest at station 15), and thus salinity, influences Zooplankton abundance and species distribution. The net was deployed into the surface water for 5 minutes at each
station, filtering samples into a 1L bottle. The samples preserved in formaldehyde and later analysed in the laboratory, where groups/orders were identified and counted as individuals per sample (10ml sample analysed per 1L bottle of each station). Using the equation V=Pi x r2 x L, (where L = towing distance(m) and r = radius of plankton net opening(m)). The volume of water sampled was calculated, and the number of individuals per m3 was calculated using N = (n x 100)/V (n= number of individuals in 10ml sample). Results are shown in Figures 8-10.

For all three stations, copepods (adults and juvenile stage) were found to be numerically most abundant. However, the zooplankton composition at each station varied significantly. Furthest up the river (station 8, Figure 8), cladocerans are highly abundant, however, their numbers rapidly decrease down the estuary (Figures 8-10), which is expected since cladocerans are commonly found in freshwater habitats. Zooplankton diversity increased down the estuary (stations 12 and 14), in contrast, zooplankton richness, in terms of number of individuals per sample, decreased down the estuary (181 individuals/sample, 92 #/sample and 58 #/sample for stations 8, 12 and 15 respectively). This coincides with phytoplankton abundance, which is also significantly higher at station 8 (252 cells/ml)
It is worth noting that sampling zooplankton with tow nets can involve three distinct sources of error [3], a) active avoidance of the sampling device by the organisms, b) the non-random spatial distribution of organisms and c) mechanical problems of the gear such as clogging of the mesh, imperfect measurements of the amount of water filtered and the extrusion of organisms.
GO TO:

Figure 7 clearly shows that diatoms are the most abundant phytoplankton type in the Fal estuary during the early summer. They are also the most versatile; about 9 different species were found at station 11. Dinoflagellates seem to be out-competed by diatoms this time of year and are very rarely present. As the water becomes more stratified in summer, nutrients become available to phytoplankton and small but fast growing phytoplankton will take advantage of the situation and start to bloom. Only when a limiting factor limits the diatom bloom can other out-competed phytoplankton species start to grow. Dinoflagellates were only found at one station: station 8, where species including Ceratium fusus and Karenia mikimotoi were observed. The limiting factor in this case could be silicate, as it is needed for frustule formation in diatoms. After the big diatom bloom reaching 243 diatoms per ml (Figure 1), silicate must have run out at station 8, leaving nutrients for out-competed dinoflagellate species[1].
Figure 6 demonstrates that there is a decreasing abundance of cells per litre as
you move closer to the mouth of the estuary and salinity increases. This is probably
due to the stratification of the water[2]. As the Fal estuary has a tide dominated
flow, more mixing happens at the mouth of the estuary, making it hard for phytoplankton
to reach their nutrients and the required amount of sunlight.
The genus Chaetoceros is the most abundant group of diatoms throughout the entire sampled estuary, as seen in Figures 1-5. However, the importance of abundance of Chaetoceros decreases as the stations approach the mouth; 81% at station 8, to 48% at station 12, and finishing at 24% at station 15. Diatom diversity also decreases with the stations; 9 different species at station 11, to only 4 at station 15. Nitzchia and Rhizosolenia species are examples of reoccurring diatoms. Mesodinium rubrum was the only ciliate found throughout the estuary; found in small amounts but found at every station. This could suggest a lack of competition between diatoms and ciliates, even if diatoms remain the most dominant phytoplankton type in the estuary during this time of year.

SPECIES IDENTIFIED; MOST ABUNDANT(rollover to expand):


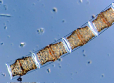


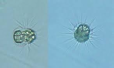
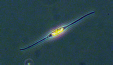
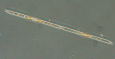


Figure 9 - Zooplankton richness at station 12. No. of individuals of each group per m3 by percentage. 8 groups identified in the sample.
(Click to expand)


SPECIES IDENTIFIED; MOST ABUNDANT(rollover to expand):


References
[1] Mann, K.H. and Luzier, J.R.N. Dynamics of Marine Ecosystems: Biological-Physical Interactions in the oceans, Oxford:Blackwell Publishing ltd., pp68-117 (2006)
[2] Kremp, A. Tamminen, T. and Spilling, K. Dinoflagellates bloom formation in natural assemblages with diatoms, nutrient competition and growth strategies in Baltic spring phytoplankton, Aquatic Microbial Ecology, 50, pp181-196 (2008)
[3] Wiebe, P. H. & Holland, W. R. Plankton patchiness: Effects on repeated net tows. Limnology and Oceanography. 13, 315-321 (2004)


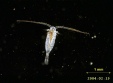


Figure 1 - phytoplankton species and percentage abundance at station 8 (A).
(Click to expand)
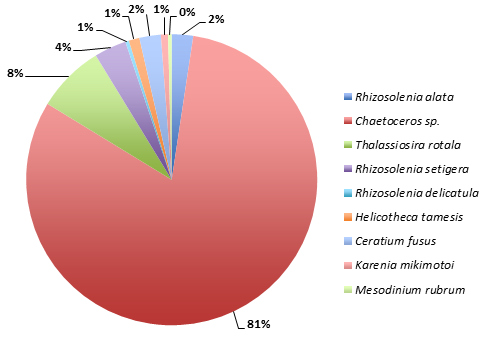

Figure 2 - phytoplankton species and percentage abundance at station 11.
(Click to expand)
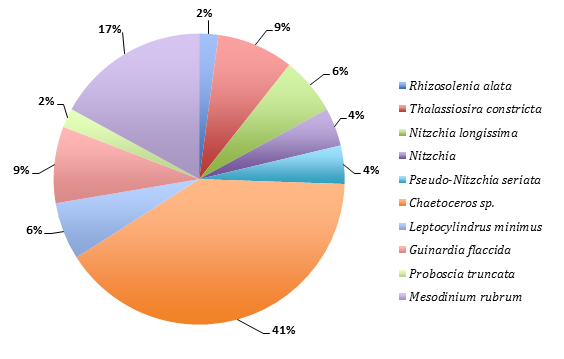

Figure 3 - phytoplankton species and percentage abundance at station 12.
(Click to expand)
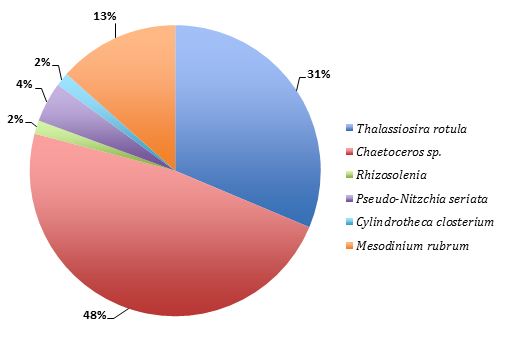
Figure 4 - phytoplankton species and percentage abundance at station 13.
(Click to expand)
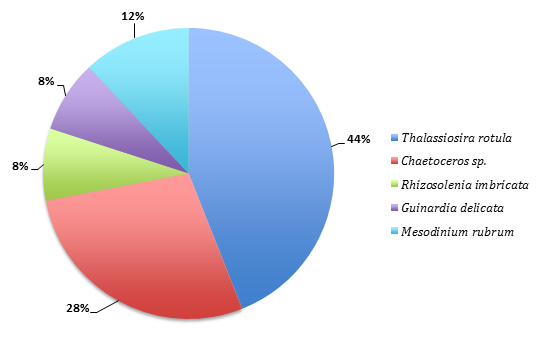
Figure 5 - phytoplankton species and percentage abundance at station 15.
(Click to expand)
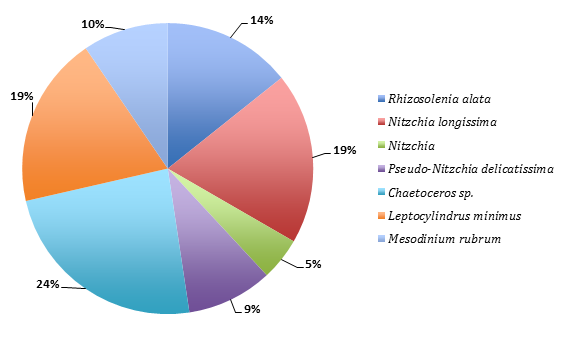
Figure 6 - abundance of phytoplankton at each station
(Click to expand)
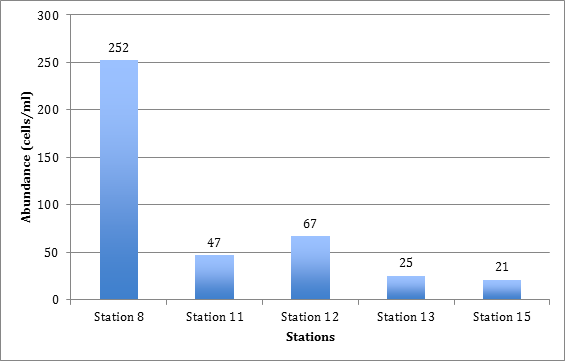
Figure 7 - percentage of phytoplankton species at each station.
(Click to expand)
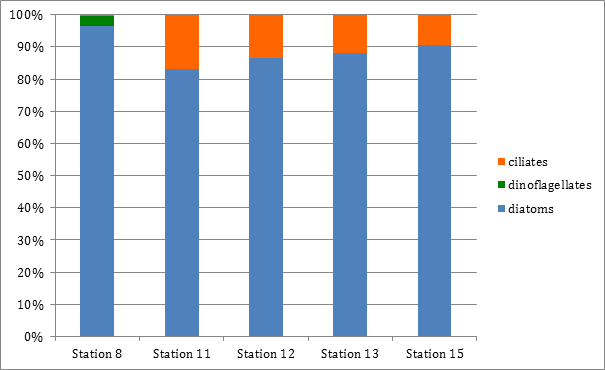
Figure 8 - Zooplankton richness at Station 8. No. of individuals of each group per m3 by percentage. 6 groups identified in the sample.
(Click to expand)
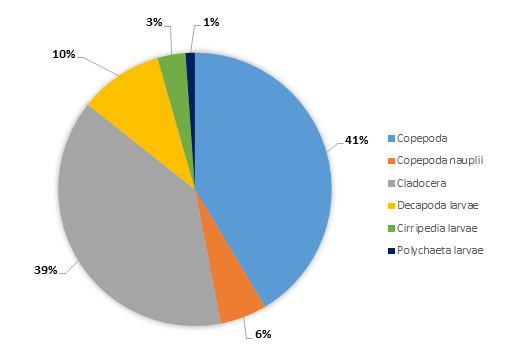
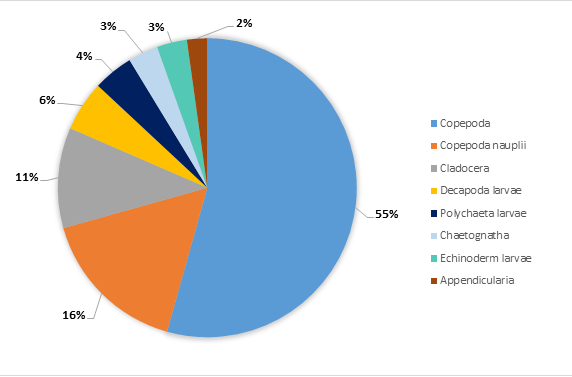
Figure 10 - Zooplankton richness at station 15. No. of individuals of each group per m3 by percentage. 8 groups identified in the sample.
(Click to expand)

RESULTS:
RESULTS:
These images are not property of group 12.
Copyright belongs to photographers.
These images are not property of group 12.
Copyright belongs to photographers.