


University of Southampton 2015©

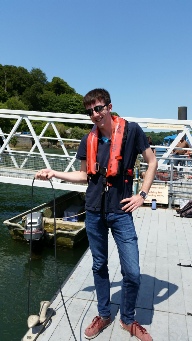
PONTOON


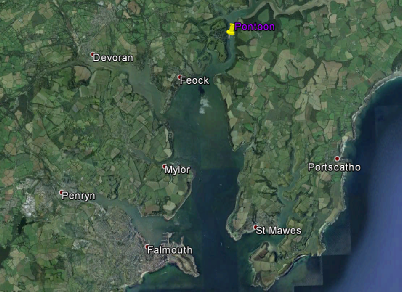
INTRODUCTION:
The Pontoon is located halfway up the Fal estuary near the King Harry ferry close to the Trilissick Garden. Different parameters of the water column were surveyed in order to investigate the effect of time and tidal flow on the physical and chemical changes within the water column. A flow meter was used to measure flow and flow direction. A YSI probe was used to measure depth, temperature, salinity, chlorophyll, oxygen, turbidity, conductivity and pH. A light meter measured light intensity at the surface and throughout the water column. Samples were taken every 30 minutes starting at 11:30 UTC until 15:00UTC.
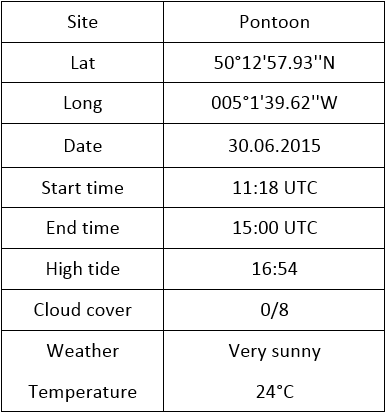

Pontoon details
(Click to expand)
The YSI digital multi-parameter system was used for profiling the water column over the semi-diurnal tidal cycle. Taking measurements every 30 minutes, as approaching high tide (15:54UTC), a series of patterns were observed. These are described here.
As shown in Figure 1, the whole water body decreased in temperature by 2°C from the start of the survey (11:30 UTC) towards the end (15:00UTC). This decrease in temperature correlates with an increase in salinity (Figure 2) as the tide rises, and cooler, more saline water flows upstream. Furthermore, the uppermost 2m of the water body remain relatively constant in temperature (mean = 17.186 ± 0.78stdv), this is due to solar radiation heating the surface layers (Figure 8).
With the incoming tide, saltier and thus denser seawater flows upstream, underlying a fresher water layer. However, vertical stratification is quickly broken down by vertical mixing due to the strong tidal current, resulting in relatively uniform vertical salinities over depth (Figure 2). Such a profile is characteristic for well-mixed estuaries where tidal flow dominates over the river flow[1].
Whilst the river water was observed to be very turbid, visibly by the high suspension
of particulate matter in the water column, turbidity decreased throughout the day
as high tide was approached (Figure 3). As the water depth increases, bottom shear
has a decreased impact on the whole water body. A similar picture was observed in
chlorophyll concentrations, which were also found to decrease with the rising tide
(Figure 4). The whole water column was supersaturated with respect to oxygen throughout
the survey period. However, oxygen did decrease by 20% between 11:30 and 15:00UTC
(Figure 5). The peak in oxygen around 11:30UTC is caused by high primary production,
which is indicated by high chlorophyll concentrations at this time (Figure 4)[2].
Furthermore, increased salinity, as high tide approaches reduces the amount of oxygen
that can dissolve in the water. Although pH decreased by 0.10 over time, no significant
change was observed (Figure 6).
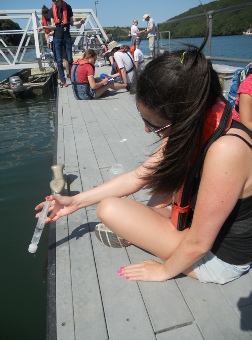
Additionally, replicate surface chlorophyll samples
were collected and subsequently analysed in the laboratory. Concentrations ranged
from 0.0844±0.074stdv to 2.393±1.16stdv µg/L with a general trend of increase over
time (Figure 7). However, an anomaly in concentration was observed at 1400UTC.

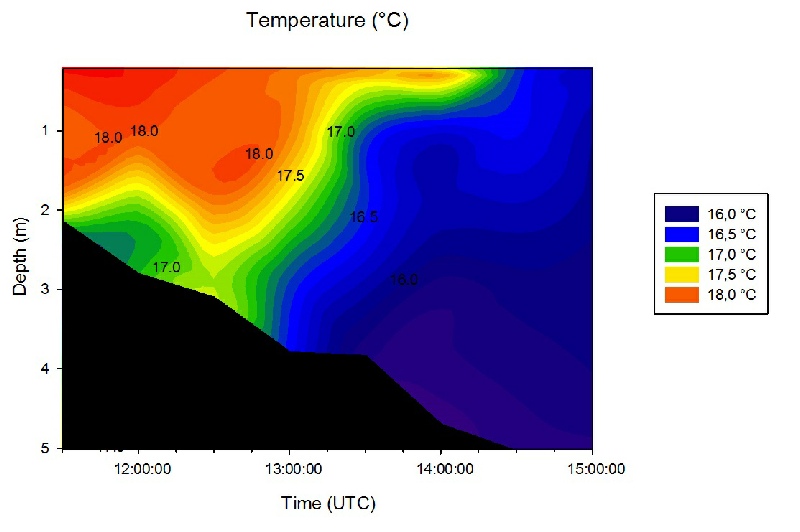
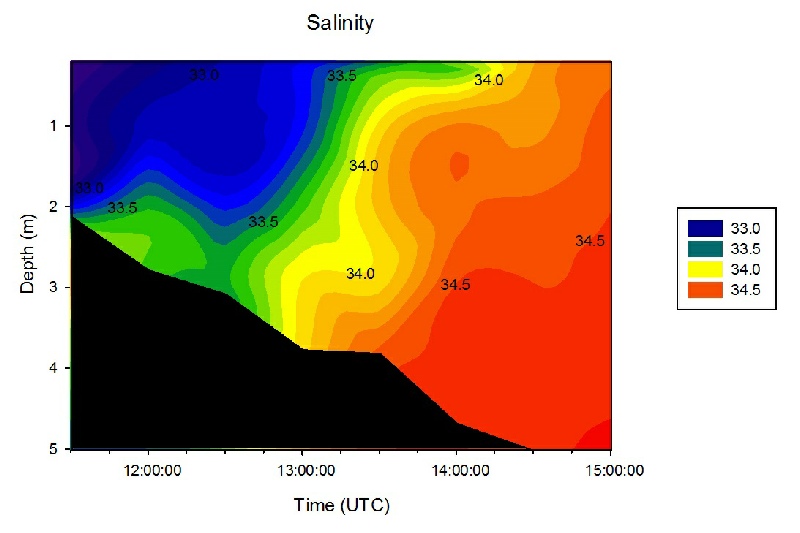
Figure 1 - Change in temperature(°C) over time and depth.

Figure 2 - Change in salinity over time and depth.
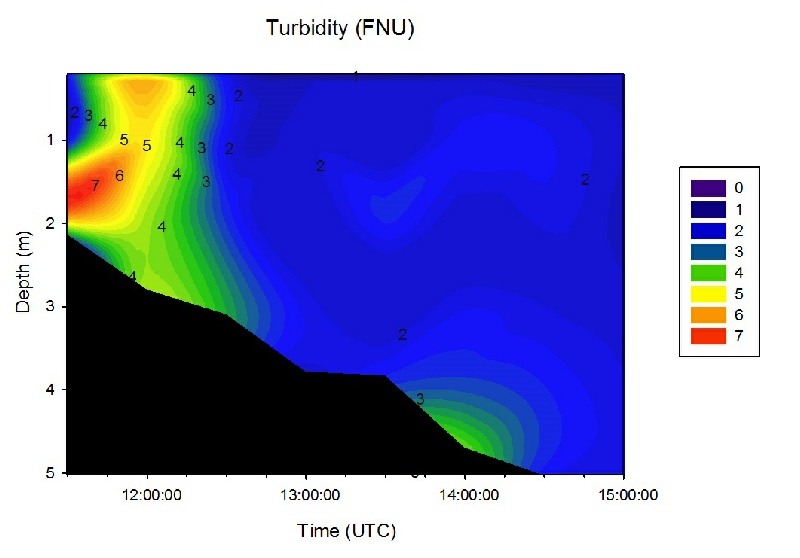
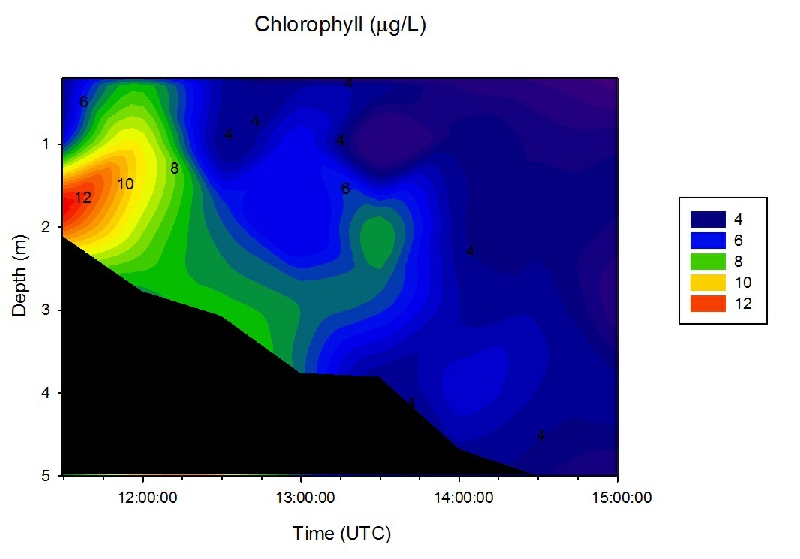

Figure 3 - Change in turbidity over time and depth.

Figure 4 - Change in chlorophyll over time and depth.
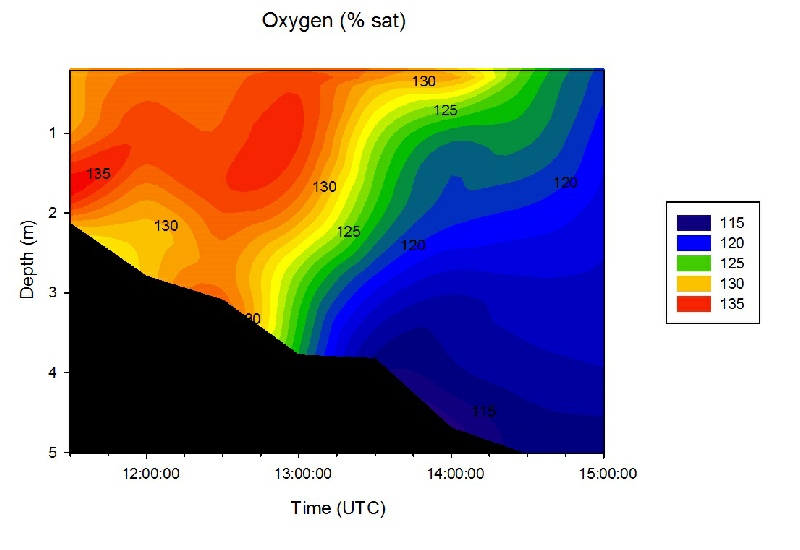
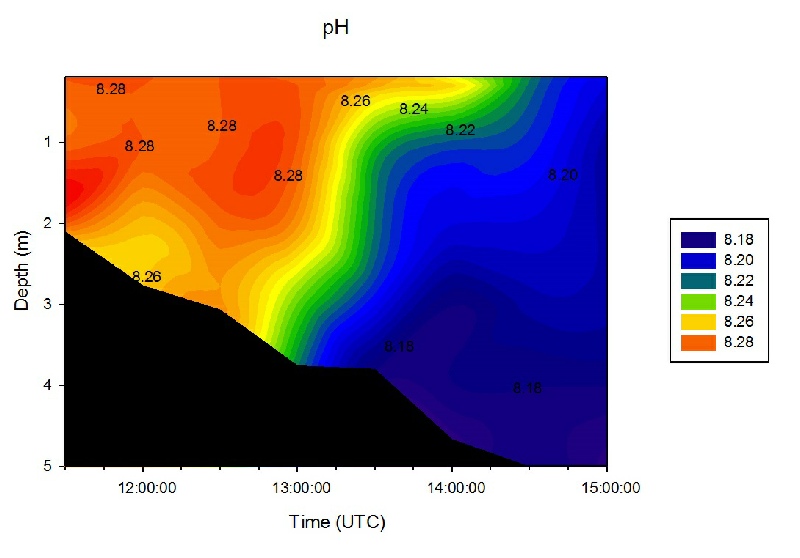

Figure 5 - Change in oxygen over time and depth.

Figure 6 - Change in pH over time and depth.
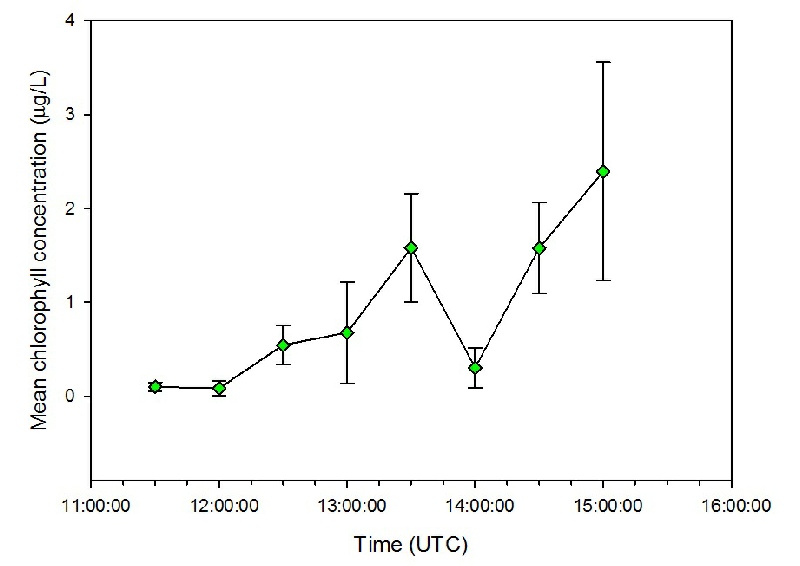
Figure 7-Change in surface chlorophyll over time and depth.
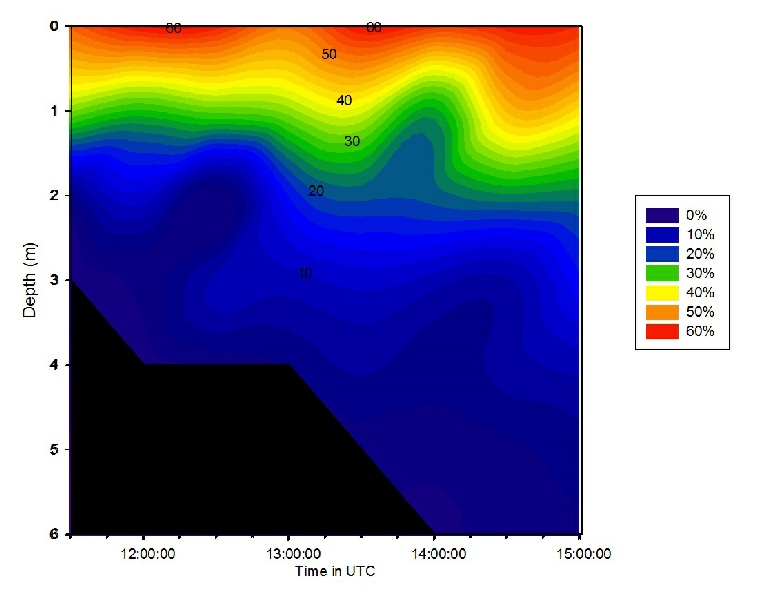
Figure 8- Change in irradiance over time and depth.
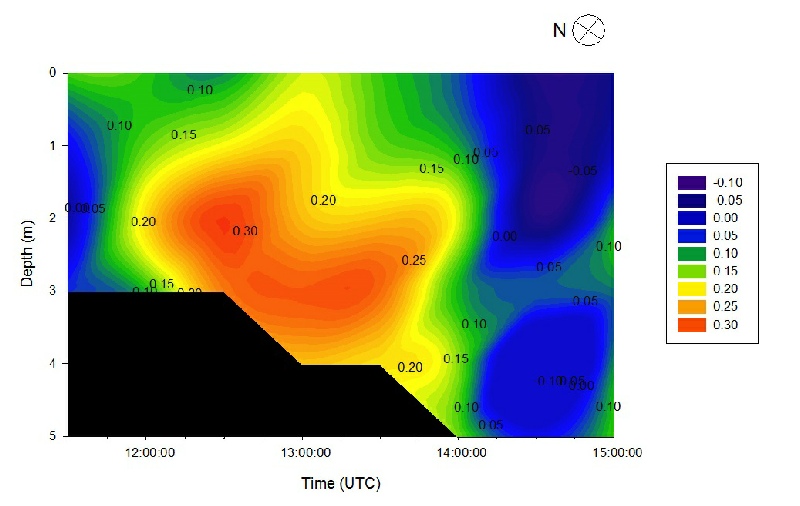

Figure 9 - Flow velocity and direction over time and depth. Positive numbers indicate northward flow, negative numbers indicate reversed flow direction, where the magnitude of the number indicates velocity (m/s).

References:
[1] Ross, D.A. Introduction to Oceanography, Harper Collins College Publishers, New York, (1995)
[2] Behrenfeld, M. J. et al. Climate-driven trends in contemporary ocean productivity. Nature 444, 752-755 (2006)

Mixing (Figure 10):
The stations calculated were measured from 11.30 UTC, with the tide rising to high tide at 14.55 UTC, and an end time of 15.00 UTC. This meant that deeper depths were recorded later in the day because of the incoming tide. From the data interpreted you can see that all stations expect profile 8 at around 4m depth show an Ri<0.25, which suggests that the water column at the pontoon was turbulent. This turbulence would likely be created by the shear between overlying fresh water and denser, saltier water bought in from the tide. The difference in velocity speeds creates this small-scale turbulence which generates mixing.
The first profile recorded shows an increase in Richardson number throughout depth across the depth range which is not seen in any other profile. All other stations show a considerable range in Ri over depth, especially profiles 2-6, which fluctuate a lot in the upper 5m.
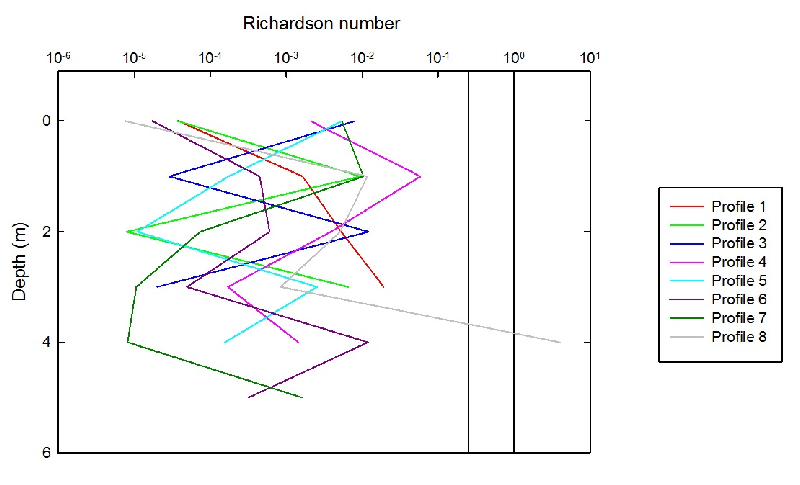

Figure 10 - Depth profile for Richardson Number at each time series station. Reference lines show boundary between turbulent flow (<0.25) and laminar flow (>1)
(Click to expand)
(Click to expand all Figures.)