

University of Southampton 2015©

CHEMICAL ANALYSIS

GO TO:

SAMPLING:
On the 27th June 2015, data was collected between groups 2 and 12 to produce a time series of information for that day. Group 12 sampled from 13:15UTC, again using rosette mounted Niskin bottles to retrieve the samples at three depths; one at the bottom, one in the fluorescent maxima layer at the thermocline and the last at the surface. The samples were prepared in the same way as they were for the Estuary Chemical Analysis. However, some samples were stored incorrectly due to a lack of bottles onboard the RV Callista, and so nutrients were only analysed for the first measurements taken at station 40.


SAMPLE STORAGE AND LABORATORY ANALYSIS:
After sampling, nitrate samples were stored in labelled brown glass bottles, and the following day these samples were analysed in the laboratory to obtain numerical values for nitrate concentration.

RESULTS:

Depth profile (Figure 1):
At every station other than station 35 the bottom concentrations of nitrate were higher than the surface concentrations. For station 35 the bottom concentration was lower than at the surface.
In the middle of the water column nitrate levels decreased throughout the day from 2.75ug/l down to 0.8ug/l over the space of 5 hours. Bottom water samples follow a similar trend decreasing in concentration over the day from 4.8ug/l to 1ug/l. Station 35 showed the largest variation in data of 3ug/l from the surface down to 28m.
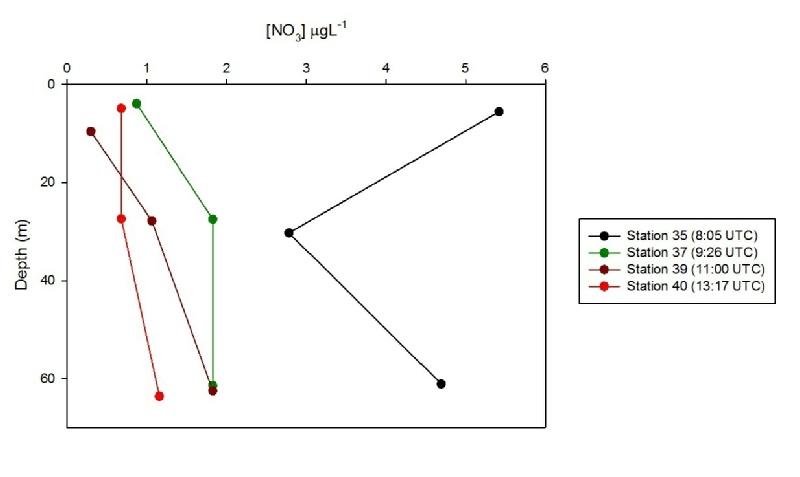

Figure 1 - Depth profile for nitrate at each station.
(Click to expand)

SAMPLE STORAGE AND LABORATORY ANALYSIS:
Following sampling, silicate samples were stored in labelled plastic bottles, ready for analysis in the laboratory, where values for concentration were attained.

RESULTS:

Depth profile (Figure 2):
All stations in the time series show that silica in the surface water has been stripped out, with concentrations less than 1 µgL-1. The first station in the time series, 35, shows a large spike in concentration of 8.28 µgL-1, just below the surface (12.35 m). All the other stations have 3 data points as opposed to 4, potentially causing the spike at this depth to be missed. Station 39 is the only other station with a point in this region, but it does not give any indication of a spike in silica. All stations show that the deep water (61-64m) has a higher concentration of silica than the surface water, with the lowest concentration being 2.30 µgL-1.
The stations showed no progression over time, with the changes in silica concentration happening in no particular order, most likely caused by natural variation.
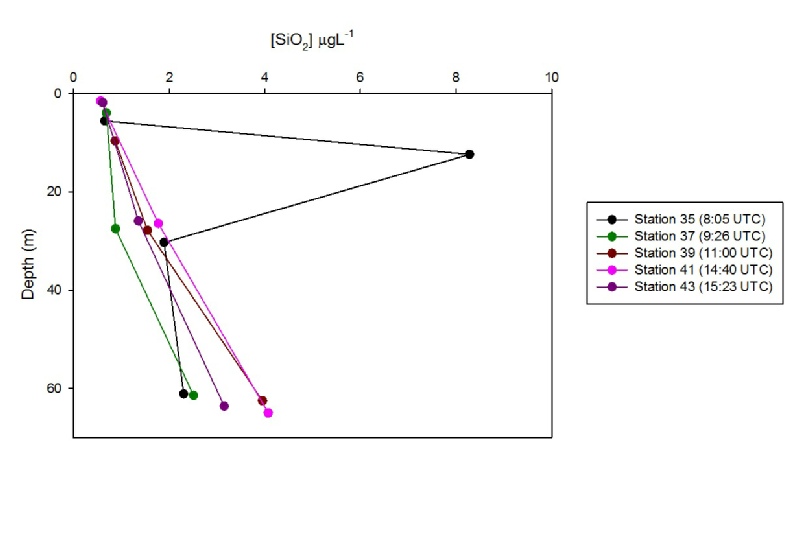

Figure 2 - Depth profile for silicate at each station.
(Click to expand)

SAMPLE STORAGE AND LABORATORY ANALYSIS:
Numbered brown glass bottles were used to store phosphate samples, until they could be analysed in the laboratory and concentration data could be deduced.

RESULTS:

Depth profile (Figure 3):
Phosphate concentrations were lowest at the surface at all stations during the time series and concentration increased with depth having the highest concentration at the deepest sample.
Figure () shows surface concentration of phosphate remained constant at around 0.025 ug/l. Over the time series variation was seen in both surface and bottom measurements. On average concentration in the middle of the water column at the chlorophyll maxima increased over the time series apart from between station 35 and 37 where a small decrease was observed of about 0.05ug/l.
Bottom concentration showed less of a clear trend over the time series, however, concentrations on all 4 times were different and showed high variability over the sampling time scale.
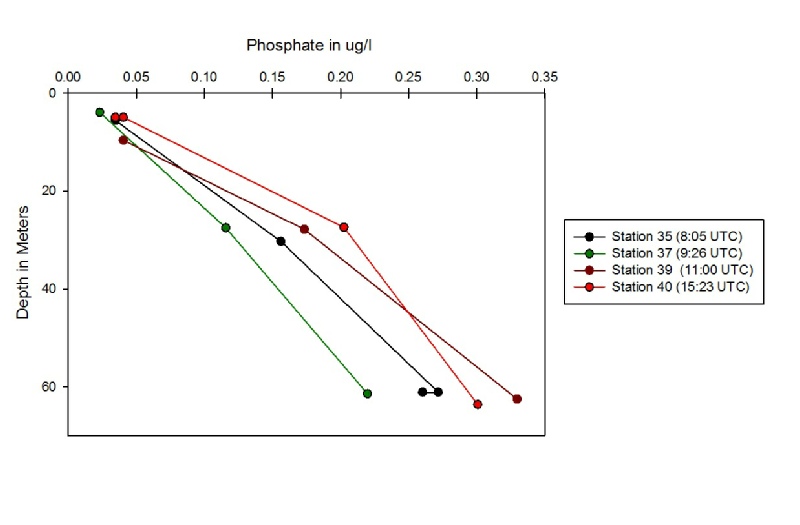
Figure 3 - Depth profile for phosphate at each station.
(Click to expand)

SAMPLE STORAGE AND LABORATORY ANALYSIS:
Immediately after samples were obtained, oxygen samples were put into glass bottles, and treated with 1ml of manganous chloride followed by 1ml of alkaline iodide solution, before being analysed to obtain numerical values the next day.

RESULTS:

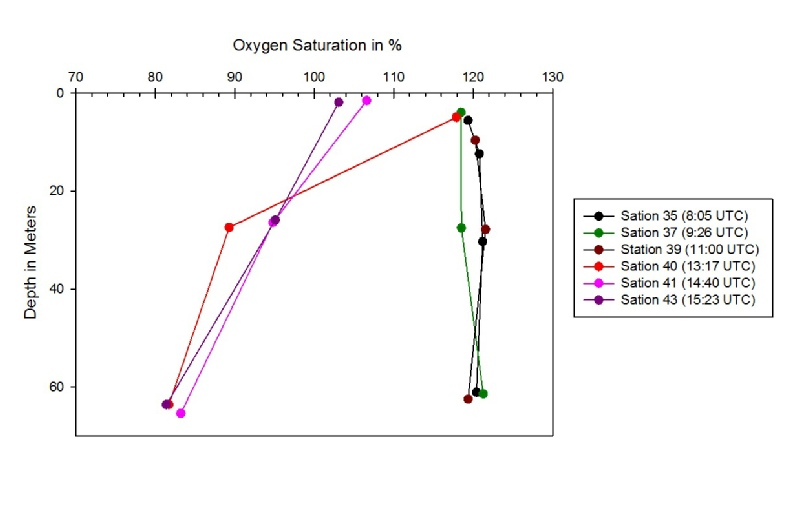
Depth profile (Figure 4):
The depth profile shows that the oxygen saturation was the highest at the surface for all stations apart from station 37 in which the bottom concentration was slightly higher. The general trend shows that, as depth increased oxygen saturation decreased. The highest percentages were recorded at the middle depth of station 39, reaching 121.57%. The lowest values were around 81.4%, at station 40 and 43.
The graph also shows a split between stations 35, 37 and 39, which show little variation between surface and bottom values and stations 40,41 and 43, which show lower surface values, which continue to decrease throughout the water column. This may relate to the Dinoflagellate bloom observed at approximately 28m.
Figure 4 - Depth profile for dissolved oxygen at each station.
(Click to expand)

SAMPLING AND LABORATORY ANALYSIS:
Values were calculated in the lab by measuring light transmission through the water samples after adding a reagent. These value were then compared to standards in which the chlorophyll values were known.
Chlorophyll is then used as a proxy for the amount for the amount of photosynthetic potential in the water column.

RESULTS:

Depth profile (Figure 5):
Figure 5 shows the surface and bottom concentrations of chlorophyll against depth at the 7 sampling stations along the estuary.
Chlorophyll concentration was measured in ug/l. Values were calculated in the lab by measuring light transmission through the water samples after adding a reagent. These values were then compared to standards in which the chlorophyll values were known.
Chlorophyll is then used as a proxy for the amount for the amount of photosynthetic potential in the water column.
The lowest chlorophyll levels in the surface were found at station 14 at 1.3ug/l compared with the highest value of 5.2 ug/l at station 11. The highest bottom level of chlorophyll was found at station 8 at 5 ug/l. Station 11 had the largest range of data between the surface and the bottom having a difference of 3.1 ug/l. Station 10 had the smallest range of 0.3ug/l. In general surface concentrations are higher than bottom concentrations apart from at stations 14 and 8 in which bottom concentration of chlorophyll was higher than at the surface.

CTD data (Figure 6):
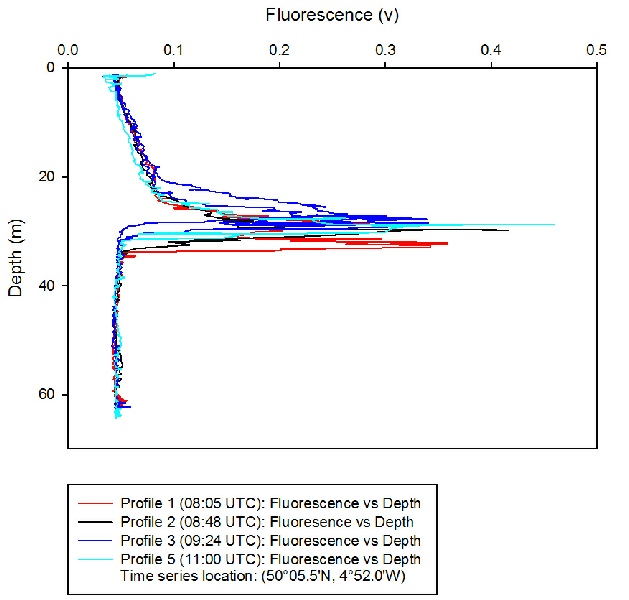
A clear chlorophyll maximum can be observed around 27m depth at all stations over the time series by measuring the fluorescence. A fluorimeter mounted onto the CTD rosette was used to measure the fluorescence given by the chlorophyll pigment in phytoplankton cells. Chlorophyll, as a pigment, emits a red fluorescence when stimulated by blue light and the fluorimeter measures the amount of red light emitted[1]. By comparing the 2 sets of data collected over the time series, it is evident that there is a degree of vertical migration observed in the amount of fluorescence between the two sets of data, the fluorescence shows the vertical migration of phytoplankton cells over the day. The phytoplankton migrate closer to the boundary of the thermocline, as observed in the temperature profiles.
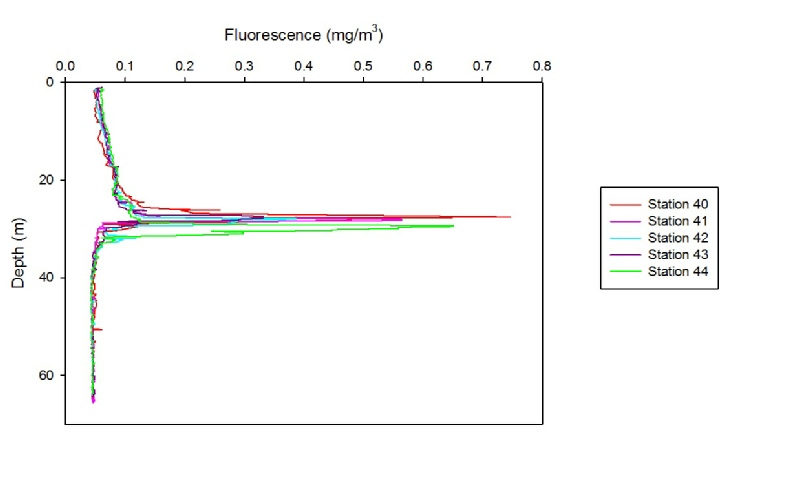

Figure 6 - Depth profile for fluorescence at each time series station (afternoon)
(Click to expand)

References:
[1] Eicken, H., Field techniques for sea-ice research, Fairbanks: University of Alaska Press, p267 (2009)
Figure 5 - Depth profile for fluorescence at each time series station (morning)
(Click to expand)