


All the information shown on this website are our own views and not those of the NOCs or the University of Southampton


On the morning of the 26th of June, a time series observing salinity, temperature, turbidity, pH, dissolved oxygen, light absorbance, chlorophyll and flow speed and direction, was recorded at the King Harry pontoon in the Fal Estuary. There are a large number of factors that can effect these parameters on a daily basis within an Estuary ranging from the tidal state to the weather. The time series collected by our group aimed to look in to any variation that might occur over a micro time scale of four hours by taking 7 vertical profiles through the water column every half hour.
Flow speed and direction was recorded using a current metre and measurements were taken at 1 meter intervals every 30 minutes. Water samples were taken every half hour that were then analysed using a fluorimeter to calculate surface chlorophyll concentrations. A YSI probe was used to measure salinity, temperature, turbidity, pH, dissolved oxygen, and chlorophyll, every half house at 1 meter depth intervals. All readings were taken at the same time starting at 09:30 BST and ending at 12:30 BST.
Aim:
Investigate daily variation in biological and physical parameters of the Fal Estuary
Objectives:
Investigate variation in current with depth over a time series.
Investigate variation in surface chlorophyll over a time series.
Investigate changes in temperature, salinity, turbidity, pH, dissolved oxygen, and chlorophyll with depth over a time series.
Pontoon
METADATA
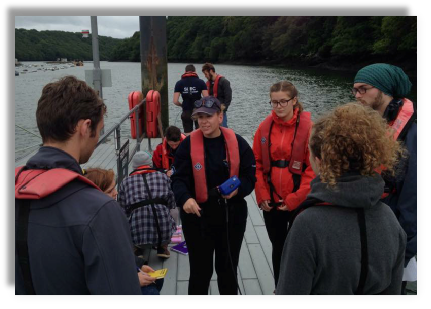
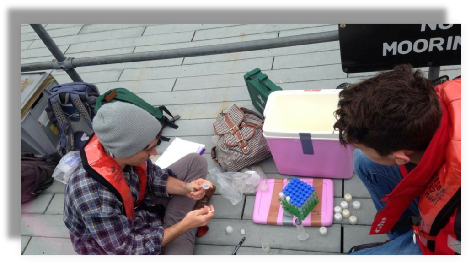
Figure 2. 1. Group 11 collection data on the pontoon
|
Date: |
26/06/2015 |
|
Time |
09:30 - 12:30 BST |
|
Location: |
50⁰12.976N 005⁰01.661W |
|
Weather: |
Windy. Light rain. Cloud cover: 8/8 |
|
Water depth: |
4 - 5 m |
|
Average wind direction: |
Southwesterly |
|
Tide: |
High water - 00:25 BST(4.2 m ) |
Flow speed and direction was recorded using a current metre and measurements were taken at 1 meter intervals every 30 minutes. Water samples were taken every half hour that were then analysed using a fluorometer to calculate surface chlorophyll concentrations. A YSI probe was used to measure salinity, temperature, turbidity, pH, dissolved oxygen, and chlorophyll, every half house at 1 meter depth intervals. All readings were taken at the same time starting at 09:30 BST and ending at 12:30 BST.
METHODS
INTRODUCTION
Figure 2.3. Will and Tom filtering surface chlorophyll samples
Chemical
pH typically decreases with depth. Profiles 1 and 2 show little variation but profiles 3-7 show a decrease with depth however the magnitude of this effect is small a change of 0.08 as the largest observed change. The maximum pH measured was 8.27 and the minimum pH was 8.18. Surface pH measurements ranged between 8.23 and 8.26 whereas pH from the maximum depth ranged between 8.18 and 8.24.
Percentage O2 saturation decreases with depth, with greater O2 concentrations being observed in the first profiles. However, between 2-3m, dissolved oxygen % increases from the surface values before decreasing at higher depths. With increasing time the samples show lower O2 concentrations but all samples measured are supersaturated with respect to oxygen as the lowest value measured was 120.7% and the highest value measured was 138.0%.
Physical
Temperature shows a negative relationship with depth, with temperatures dropping by between 0.1 to 0.7°C. The change in temperature becomes more pronounced as time progresses as the tide is in flood, with increasing input of cooler marine waters. This causes a decrease in temperature from 16.877°C at 3.052m (profile 1) to 16.195°C at 3.012m (profile 7). The temperature measurements at the surface have a smaller range between 16.748°C and 16.851°C compared to the deeper temperature measurements that range between 16.076°C and 16.695°C.
Salinity shows a variable relationship with depth. Profiles 1 and 2 show little variation with depth but profiles 3-7 show a marked increase in salinity with depth. This is due to the flood tide adding more dense and saline waters to the bottom of the water column. Profiles 1 and 2 have a small salinity range; with profile 1 ranging between 33.57 and 33.70, and profile 2 ranges between 33.64 and 33.87. Overall, salinity at profiles 2-7 range between 33.64 and 34.0.
(Flow meter) Current flow rates show no significant trends with depth or over time. This is likely due to the effect of local hydrodynamics around the pontoon and the importance of passing vessels.
(Light meter) Irradiance shows consistent exponential decrease with depth across all profiles. The surface irradiance increases during the day, so that profile 7 has the highest irradiance values. The lowest surface irradiance was 169.7 µmol/m2/s at profile 2 and the highest irradiance value was 283.1 µmol/m2/s at profile 7. Irradiance values at depth where much closer together for all seven profiles, ranging between 3.0 µmol/m2/s and 10.5 µmol/m2/s.
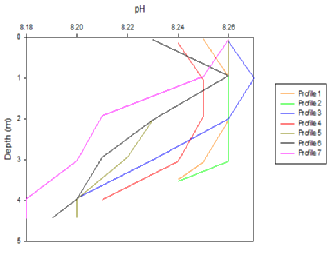
Figure 2.4. Vertical profile of the chlorophyll and nutrients (Nitrate and Silicon) concentration [ugL-1] vs depth (m) for station 16.
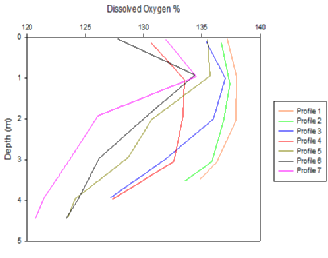
Figure 2.5. Vertical profile of the chlorophyll and nutrients (Nitrate and Silicon) concentration [ugL-1] vs depth (m) for station 16.
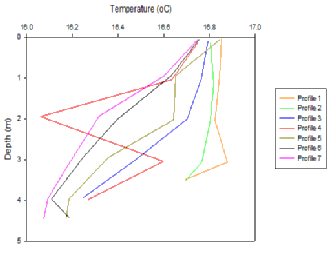
Figure 2.6. Vertical profile of the chlorophyll and nutrients (Nitrate and Silicon) concentration [ugL-1] vs depth (m) for station 16.
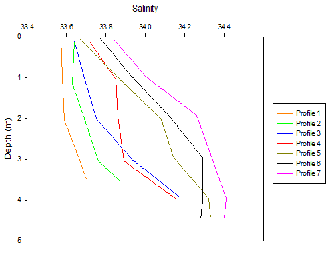
Figure 2.7. Vertical profile of the chlorophyll and nutrients (Nitrate and Silicon) concentration [ugL-1] vs depth (m) for station 16.
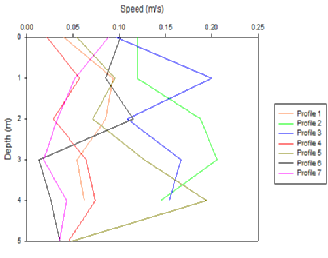
Figure 2.8. Vertical profile of the chlorophyll and nutrients (Nitrate and Silicon) concentration [ugL-1] vs depth (m) for station 16.
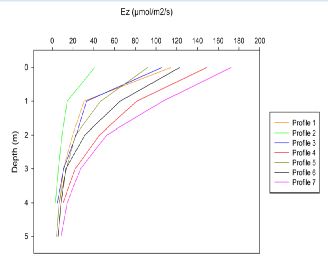
Figure 2.9. Vertical profile of the chlorophyll and nutrients (Nitrate and Silicon) concentration [ugL-1] vs depth (m) for station 16.
CONCLUSION.
We took measurements on a pontoon in the Fal estuary to see how a collection of parameters changed in one position over a short amount of time. During this time the estuary experienced the effects of a flood tide. A few parameters showed little patterns of change over the 3 hour period, such as dissolved oxygen, pH and water speed. However water velocity direction did change over the course of time. In the first few measurements, earlier in the day, the main direction of the water was northwards, into the estuary. After this time, the main direction of flow was southward, towards the mouth of the estuary, showing the slowing of the flood tide as it approached high tide at 12.09 UTC. Usually the whole water column flowed in the same direction, but in a few cases, there was discrepancies with direction between the bottom and top of the water column. Temperature and salinity also changed with time, becoming more stratified as the day went on, showing how the input of more saline marine water creates a stratified system. Chlorophyll concentrations increased as the time reached noon. This demonstrates well the dependence of primary producers on light. Overall it can be very useful to measure a specific station over a period of time. It would be very interesting to continue the study and compile a time series of how the conditions of the estuary at this particular point change over the course of a season or a year.
REFERENCES.
| Biological |
| Chemical |
| Physical |
| YSI Probe |
| Current Meter |
| Chlorophyll |
| Sidescan Sonar |
| Underwater Video |
| Poster |
| Biological |
| Chemical |
| Physical |