


All the information shown on this website are our own views and not those of the NOCs or the University of Southampton


CHEMICAL LABORATORY.
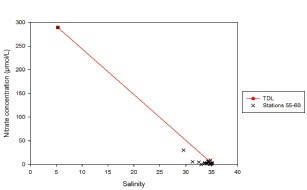
Figure 5.10. Nitrate mixing diagram; nitrate concentration (µmol/L ) vs salinity.
Nitrate mixing diagram.
Stations 55-60 are located progressively further along the estuary. The nitrate depth profiles show that nitrate concentrations vary slightly with depth, however the significant change in nitrate concentrations can be observed between stations. Nitrate concentrations increase from 1.4 µmol/L at Station 55 in the surface waters to 29.8 µmol/L at Station 60 in the surface waters. The nitrate concentrations of the depth profiles therefore also increase accordingly, due to the mixing that is taking place. Increasing nitrate concentrations throughout the water column may be explained due to riverine inputs, whereas decreases in nitrate concentrations throughout the water column may be explained through phytoplankton uptake and/or mixing with the seawater. Station 56 has the most homogenous water column with respect to nitrate concentration as it ranges between 0.8 µmol/L and 1.2 µmol/L.
Silicon mixing diagram.
The direction of travel from station 55 to 60 was up the estuary.
The estuary is non-conservative as the data points on the estuary mixing diagram do not fit closely to the theoretical dilution line; they are situated below it, so silicon is removed from the estuary system. There are no stations in the salinity range 7-28, which makes the conclusion above not necessarily accurate. The apparent gap in the data can be explained by the inaccessibility of the river past a certain point; it became too shallow for the boat to travel any further. The riverine end member was obtained separately, and there would not have been enough time to obtain samples for the salinity range mentioned before. Furthermore, the river end member is not representative of the silicon concentration as the salinity is not 0. In order to get a theoretical river end member value, the theoretical dilution can be extrapolated so that at a salinity of 0, one would expect a silicon concentration of 73.1 µmol/L. The removal of silicon may be due to its uptake by phytoplankton such as diatoms, which utilise silicon for their tests.
Phosphate mixing diagram.
The phosphate mixing diagram shows how phosphate concentrations change inversely with salinity as concentrations increase when salinity decreases. The theoretical dilution line represents how phosphate would behave in the estuary with it was behaving conservatively. Rivers are a significant phosphate input, which explains the high phosphate concentrations at the measured river end member. As the river end member we collected is not at 0 salinity, the theoretical river end member can be extrapolated from the theoretical dilution line to be 3.2 µmol/L. Similar to the other nutrient samples, data collected falls between a salinity range of 30 and 35.
A few of the measured concentrations follow the theoretical dilution line, however there is also a visible removal of phosphate present represented by the points below the line. In particular, there was significant removal at station 58 at a depth of 3.06m (Salinity: 32.55 and Phosphate: 0.109 µmol/L) and station 59 at a depth of 0.988m (Salinity: 31.32 and Phosphate: 0.189 µmol/L). This is most likely due to the presence of large phytoplankton communities that are utilising the phosphate. Contrastingly, there also seems to be some addition of phosphate, which is represented by the crosses that lie above the theoretical dilution line. This may be due to riverine inputs or anthropogenic inputs. In order to obtain a better overview of how phosphate mixes in the Fal estuary, more water samples at lower salinities would be necessary.
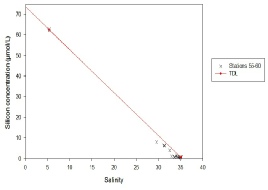
Figure 5.11. Silicon mixing diagram; silicon concentration (µmol/L ) vs salinity.
From each of the niskin bottles a sample was taken to allow the analysis of chlorophyll content, nitrate, phosphate and silicon concentration.
Chlorophyll - 60 ml was taken up by the syringe which was then attached to the filtering system.
10 ml was pushed through the filter paper, it was then checked to see if there was any damage to the paper causing leakage.
If it wasn't damaged, then 50 ml was slowly pushed through the filter paper.
The filter paper was then removed, folded and placed in a 100% acetone solution.
For each niskin bottle sample, 3 sub samples were collected to allow an average to be calculated.
Nitrate - 50 ml was taken up into the syringed and pushed through to cleanse the syringe.
An additional 50 ml was taken up and was pushed through the filter into a glass bottle.
Phosphate - Same protocol as nitrate.
Silicon - same protocol as Nitrate, however samples were stored in plastic bottles.
Nitrate depth profile.
Nitrate concentrations increase inversely with salinity because rivers are a large source of nitrate inputs (reference). The theoretical dilution line, represented in the nitrate mixing diagram shows how nitrate would behave in an estuary if it was behaving in a conservative nature. The samples collected were all at high salinities, as a result of the incoming tide, so the values are clumped together between salinity values of 29.5-35. In areas of high salinity, nitrate is undergoing removal as the concentrations are below the theoretical dilution line. The Fal estuary is tidally dominant and therefore supports a lot of phytoplankton. Large phytoplankton communities are responsible for the removal of nitrate as they require nitrate for growth. In order to see how nitrate behaves throughout the entire estuary, more water samples would be necessary, especially at lower salinities.
Silicon depth profile.
On the silicon depth profile for all stations, the stations further up the estuary display riverine influence; the decrease in silicon concentration is greater than at the seaward end. At the seaward end, silicon is scavenged by diatoms etc., explaining the lower concentrations observed there. The depth of the silicon concentrations is dependent on tidal height.
Phosphate depth profile.
Generally, phosphate concentrations increase with depth and up the estuary. However, at station 55 and 59, the phosphate concentrations decreased from the middle depth sample to the deep water sample. This may be due to the uptake from phytoplankton as phosphate is an important nutrient necessary for growth. Phosphate concentration was the lowest at station 55 at 1.06m, with a value of 0.104 µmol/L, and the highest value (when discounting station 60) was at station 57 at 14.78m, with a value of 0.270 µmol/L. Phosphate point sources, such as from boats, may explain the anomaly found at Station 60, where the phosphate concentration was 29.56 µmol/L at 0.56m.
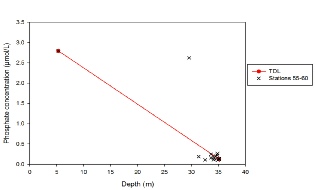
Figure 5.12. Phosphate mixing diagram; phosphate concentration (µmol/L ) vs salinity.
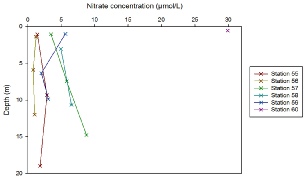
Figure 5.13. Nitrate depth profile; nitrate concentration (µmol/L ) vs Depth (meters) for station 55, 56, 57, 58, 59 and 60.
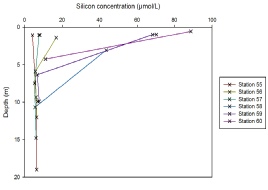
Figure 5.14. Silicon depth profile; silicon concentration (µmol/L ) vs Depth (meters) for station 55, 56, 57, 58, 59 and 60.
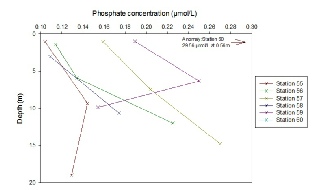
Figure 5.15. Phosphate depth profile; phosphate concentration (µmol/L ) vs Depth (meters) for station 55, 56, 57, 58, 59 and 60.
REFERENCES.
DeMaster, D. (1981) The supply and accumulation of silica in the marine environment. Geochimica et Cosmochimica Acta, 45, (10) 1715-1732.
Eyre, B. and Balls, P. (1999) A Comparative Study of Nutrient Behaviour along the Salinity Gradient of Tropical and Temperate Estuaries. Estuaries, 22, (2A) 313-326.
Loder, T. C. and Reichard, R. P. (1981) The Dynamics of Conservative Mixing in Estuaries. Estuaries, 4, (1) 64-69.
| Biological |
| Chemical |
| Physical |
| YSI Probe |
| Current Meter |
| Chlorophyll |
| Sidescan Sonar |
| Underwater Video |
| Poster |
| Biological |
| Chemical |
| Physical |