


All the information shown on this website are our own views and not those of the NOCs or the University of Southampton


Introduction.
Group 11 spent the afternoon on board RV Callista on the 24th of June, taking measurements of different parameters such as oxygen concentration, turbidity, salinity and temperature, etc., and sampling water at different depths at different stations offshore. These samples were later used in the lab session to measure chlorophyll, dissolved silicon, phosphate and nitrate concentrations.
The equipment used throughout the day includes Niskin bottles to collect water samples at different depths, CTD rosette, ADCP and a zooplankton net with diameter 60cm and mesh size 200μm.
Aim: To determine the position of plankton in the water column using depth profiles of chlorophyll and nutrients.
Background information: In Spring, phytoplankton growth is initiated by vertical mixing and stratification of the water column. Growth becomes uninhibited, and primary production (which can be estimated by measuring the chlorophyll concentration) increases, depleting nutrients such as nitrogen, phosphate and silicon. In Summer, surface water temperature increases due to more solar radiation and fewer storm events (high wind and more/larger waves), creating a more highly stratified water column and a more permanent thermocline. The phytoplankton population in this period are adapted to low nutrient levels. Mixing of the water column results in a wider distribution of nutrients (Nybakken, J. 2001), so it was predicted that the population would be situated in the thermocline (indicated by a chlorophyll maximum) because less mixing results in the distribution of phytoplankton being concentrated in an area where the nutrients and light levels are sufficiently high enough to support the population.
OFFSHORE
Metadata.
|
Date: |
24/06/2015 |
|
Location: |
Station 16 - 50⁰ 05.733N 004⁰51.995W Station 17 - 50⁰02.597N 004⁰46.268W Station 18 - 50⁰06.967 N 004⁰59.091 W |
|
Weather: |
Breezy. Cloud cover start: 6/8, end: 2/8 |
|
Water depth: |
Station 16 - 62 meters Station 17 - 65 meters Station 18 - 25 meters |
|
Time: |
13:00 - 16:00 GMT |
|
Sea state: |
Calm |
|
Tide: |
High water - 11:07 UTC (4.2 m) |
|
Vessel: |
R. V. Callista |
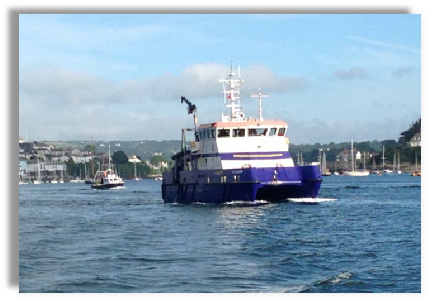
Image 2.1. The RV Callista.
Field methodology.
Sampling of the water parameters was primarily conducted from a CTD and associated niskin bottle rosette. The rosette and CTD were deployed into the water using an A-frame and winch array. The rosette was then lowered into the water and live data was observed in the dry lab. Features of interest such as thermoclines and chlorophyll maxima were noted. The rosette was stopped approximately 5m clear of the seabed using a depth sounder to gauge depth in the sample area. Niskin bottles were fired remotely from the dry lab at features of interest. The rosette was recovered to deck and samples were immediately drawn for dissolved oxygen, nitrate, phosphate and silicate. Dissolved oxygen samples were placed in glass bottles and nutrient samples were collected in plastic bottles. Suitable reagents were added and the samples were securely stored to prevent contamination. Chlorophyll samples were collected by filtering 50ml of seawater through a glass fibre filter before being stored in acetone for later analysis. Zooplankton samples were collected using a 60cm diameter plankton net with a 200µm mesh size that was deployed vertically, drawn through a sample area it was then shut by using a messenger weight. Zooplankton samples were preserved using a formalin solution. While on station current data was collected using an ADCP array.
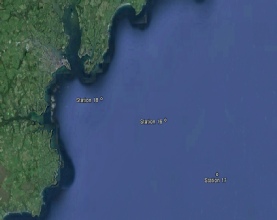
Figure 2.1. Google Earth’s caption of the 3 sampled stations.
Zooplankton.
Vertical zooplankton tows were sampled at stations 16-18 using a plankton net. At station 16 the zooplankton was towed between 35-25m, station 17 was towed between 30-25m and station 18 was towed between 22-15m. All seawater samples were 1000ml and they were stored in plastic bottles with formalin.
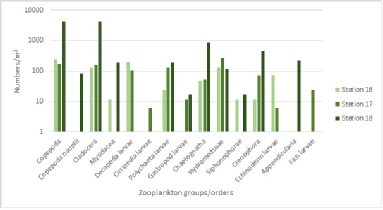
Figure 2.2 shows the numbers of zooplankton groups/orders per m3 on a logarithmic scale. Zooplankton numbers and groups present varied between stations, with station 18 distinctly having the highest total numbers present, followed by station 17 and station 16 respectively. Overall, station 18 had 11,003 numbers of zooplankton per m3, whereas station 17 had 995 numbers/m3 and station 16 had 872 numbers/m3.
At station 16, the dominant species present were copepoda (236 numbers/m3), decapoda larvae (200 numbers/m3), cladocera (300 numbers/m3) and hydromedusae (130 numbers/m3). There were no copepoda nauplii, cirripedia larvae, gastropod larvae, appendicularia or fish larvae present at station 16.
At station 17, the dominant species were hydromedusae (265 numbers/m3), copepoda (171 numbers/m3), cladocera (153 numbers/m3), polychaeta larvae (129 numbers/m3) and decapoda larvae (106 numbers/m3). There were no copepoda nauplii, mysidacea, siphonophorae or appendicularia present at station 17.
The dominant species at station 18 were copepoda (4431 numbers/m3), cladocera (4414 numbers/m3), chaetognatha (893 numbers/m3) and ctenophore (438 numbers/m3). There were no decapoda larvae, cirripedia larvae, echinoderm larvae or fish larvae present at station 18.
Figure 2.2. Groups/orders of zooplankton vs. Number/m^3 for stations 16, 17 and 18.
Phytoplankton.
When out on Callista collecting our group’s offshore samples, we forgot to collect phytoplankton samples for each of the three stations so unfortunately when processing our samples in the biology lab, we had no phytoplankton to analyse. However, group 9, sampled the same stations as us in the morning. By looking at their data, one can observe what species are dominant in the Fal area, however it is important to note that their abundance and distribution will not match our depth profiles.
CONCLUSION.
The discussion of results is ordered by station, travelling in an onshore direction. Please note that water samples taken for the measurement of phosphate were stored in plastic bottles, instead of glass, which may have reduced the accuracy of the results obtained (phosphate is adsorbed onto the plastic walls of the bottle, lowering the measured concentration), but patterns were still observed so they have been included in the discussion.
At station 17, the furthest offshore, chlorophyll peaked with a value of 3.40μmol L-1 at approximately 25-30m depth, while nitrate increased steadily after 27m depth at a low rate from a value of 1.93μmol L-1. Silicon showed a similar pattern as nitrate but with a slightly faster increase from a value of 0.59μmol L-1. Phosphate increased at a steady rate to a value of 0.00903μmol L-1 at approximately 25m depth, where the steady increase became faster. There is not an easy explanation for these observations; perhaps a more detailed investigation with samples taken at more depth locations would reveal a clearer pattern.
At station 16, chlorophyll and nitrate both peaked at approximately 30m depth, with values of 5.16μmol L-1 and 4.13μmol L-1 respectively. Silicon, however, decreased with a trough value of 0.34μmol L-1 at the same depth. Phosphate increased at a steady rate up to a value of 0.00454µmol L-1 at 23.1m depth, afterwards increasing at a faster rate to 0.0395μmol L-1 at a maximum depth of 60.5m. The position of the phytoplankton is likely to be at 30m as the trough value of silicon corresponding with the peak value of chlorophyll indicates silicon uptake with increased primary productivity. However, the nitrate data does not support this. This could be due to error in equipment; further investigation would be necessary to provide an explanation for this observation.
At station 18, chlorophyll had two peaks; the first with a value of 3.55μmol L-1 at approximately 20m and a second peak of 2.45μmol L-1 at approximately 25m. Nitrate had a trough value of 0.73μmol L-1 at approximately 20m which corresponded with the first peak in chlorophyll. Silicon increased steadily to 20m depth from 0.54μmol L-1 to 0.59μmol L-1 then the rate of increase slowed down. Phosphate increased with a similar pattern observed at the other two stations, however its end concentration was approximately half that of the others, explained by the much shallower total water depth at station 18. The position of phytoplankton is likely to be at 20m depth due to the nitrate data supporting the first chlorophyll peak, however the silicon data does not support this and again, further investigation would be needed to provide a possible explanation.
REFERENCES.
Sharples, J., Tweddles, J. F., Mattias Green, J. A., Palmer, M. R., Kim, Y. N., Hickman, A. E. … & Krivstov, V. (2007). Spring-neap modulation of internal tide mixing and vertical nitrate fluxes at a shelf edge in summer. Limnology and Oceanography, 52(5), 1735-1747.
Caperon, J., & Meyer, J. (1972). Nitrogen-limited growth of marine phytoplankton-1. Changes in population characteristics with steady state growth rate. In: Deep Sea Research and Oceanographic Abstracts (Vol. 19, no. 9, 601-618). Elsevier.
Parsons TR, Lalli C. 1984. A manual of chemical and biological methods for seawater analysis. 101-112. Pergamon Press, Oxford.
| Biological |
| Chemical |
| Physical |
| YSI Probe |
| Current Meter |
| Chlorophyll |
| Sidescan Sonar |
| Underwater Video |
| Poster |
| Biological |
| Chemical |
| Physical |