


All the information shown on this website are our own views and not those of the NOCs or the University of Southampton


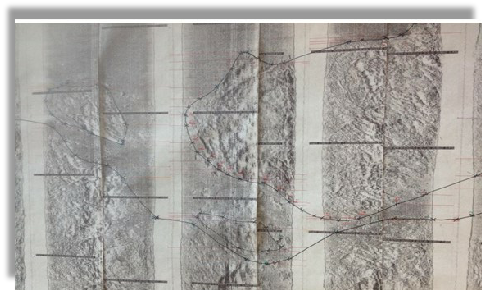
To understand the habitat type in our chosen sample area we used a subsurface dual frequency analogue sidescan sonar, which measured the rate of back scatter returning from the seabed. The returns from this apparatus allows us to visualise seabed formations and infer geological and sedimentary characteristics of the sampled area. On the 27.06.2015 between 08:15 AST and 09:05 AST we carried out four 1 kilometre transects each 100 metres apart. The location of the transects were at waypoint 177 (50⁰08.582 N, 004⁰59.990 W) and waypoint 175 (50⁰08.141 N, 005⁰00.806). The side scan sonar apparatus was towed several metres behind the vessel so that it was clear of the immediate wash created (the difference between the location of the sonar and the vessel is corrected for in later analysis). The sonar was operating at a frequency of 100 kHz and was scanning the seabed at set intervals, the returning back scatter was detected by the instrument. The rate of the backscatter is controlled by the sedimentology and the geomorphology of the estuary bed. The data was then recorded on a paper trace which was printed out allowing analysis.
SIDESCAN SONAR
Figure 1(Top) Backscatter paper trace following transects with the different boundary marks..
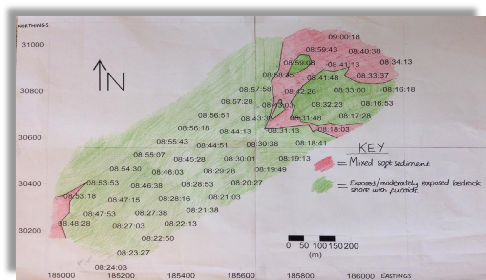
Figure 2 (Bottom) Interpretation of sediment type ad bed morphology form sidescan sonar backscatter paper trace following transects.
.

MIXED SOFT SEDIMENT.
Illustrated on the sidescan sonar (red coloured) as regions of low scatter and no significant bed form structures. Areas mainly found in the north eastern area of the transects that had been surveyed.
EXPOSED / MODERATELY EXPOSED BEDROCK SHORE WITH FUCOIDS.
Areas of high backscatter with visible bedforms. High presence along all the transects, specially south west area.
 Back to the top
| Biological |
| Chemical |
| Physical |
| YSI Probe |
| Current Meter |
| Chlorophyll |
| Sidescan Sonar |
| Underwater Video |
| Poster |
| Biological |
| Chemical |
| Physical |