


All the information shown on this website are our own views and not those of the NOCs or the University of Southampton


Of the three replicate samples taken for chlorophyll, the replicate with the highest
value was used for analysis, since it was the most effectively filtered sample.
Chlorophyll,
Nitrate and Silicon:
Station 16.
At station 16 the chlorophyll, nitrate and silicon depth profiles were measured to a depth of 60.5m. At the shallowest reading (5.4m) chlorophyll concentration was at 0.51ugL-1. It then increased in concentration to 1.5ugL-1 at 23.1m and then a further increase to 5.16ugL-1 occurred, which was the chlorophyll depth maximum at 30.8m. The concentration then decreased down to 0.29 ugL-1 at 60.5m. For the nitrate concentration at 5.4m a concentration of 0.63ugL-1 was recorded, to where it then increased to its maximum concentration of 4.13ugL-1 at 30.8m. The nitrate concentration then decreased to 3.03ugL-1 at 60.5m. The silicon depth profile increased in concentration from 0.15ugL-1 at 5.4m to 1.68ugL-1 at 23.1m, to where it then decreased to a concentration of 0.34ugL-1 at the chlorophyll maximum depth (30.8m). The silicon then increased to its greatest concentration of 2.67ugL-1 at 60.5m. The presence of diatoms and dinoflagellates, both being phytoplankton that uptake silicon, may be an explanation for the low concentration of silicon at the chlorophyll depth maximum.
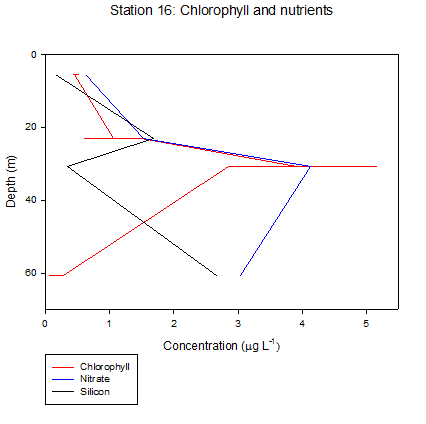
Figure 2.3. Vertical profile of the chlorophyll and nutrients (Nitrate and Silicon) concentration [ugL-1] vs depth (m) for station 16.
Station 17.
The depth profiles for station 17 were recorded to a depth of 65.7m. The chlorophyll concentration increased from 0.44ugL-1 at the shallowest reading (5.1m) to 3.4ugL-1 at 27m (chlorophyll depth maximum), at which point it decreased to 0.5ugL-1 at 65.7m. The nitrate concentration stayed constant from 5.1m to 27m at a concentration of 1.93ugL-1 and then increased to a maximum concentration of 2.33ugL-1 at 65.7m. The silicon concentration gradually increased from 0.59ugL-1 to 0.89ugL-1 from 5.1m to 27m and then increased further to a concentration of 1.86ugL-1 at 65.7m. For both silicon and nitrate the concentration gradient increased bellow the chlorophyll depth maximum. This was probably due to the fact that bellow the chlorophyll depth maximum, less phytoplankton were present to uptake nutrients.
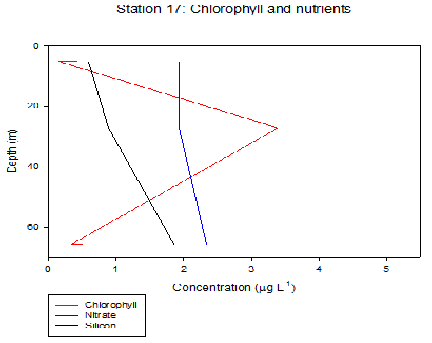
Figure 2.4. Vertical profile of the chlorophyll and nutrients (Nitrate and Silicon) concentration [ugL-1] vs depth (m) for station 17.
Station 18.
Station 18 was recorded to a depth of 25.7m. The chlorophyll concentration started at 0.52ugL-1 at 4.7m and ended at 2.45ugL-1 at 25.7m. Within this depth range the chlorophyll concentration formed a sharp peak at 19.8m with a concentration of 3.55ugL-1, this was the chlorophyll depth maximum. At 4.7m the nitrate concentration was 2.53ugL-1, then it decreased to a concentration of 0.73ugL-1 at 19.8m and then finally increased to 1.83ugL-1 at 25.7m. The silicon’s initial concentration at 4.7m was 0.544ugL-1. Then the fastest rate of concentration increase occurred to a depth of 9.8m with a concentration of 1.67ugL-1, at which point the rate of increase reduced and continued to a final depth of 25.7m, with a concentration with 1.84ugL-1. The decrease in nitrate concentration at 19.8m could be attributed to being at the same depth as the chlorophyll depth maximum, since the phytoplankton present would uptake the nitrate. On the other hand, silicon did not show a decrease around the chlorophyll maximum, this might be due to the lack of silicon-utilising phytoplankton species like diatoms and dinoflagellates being present.
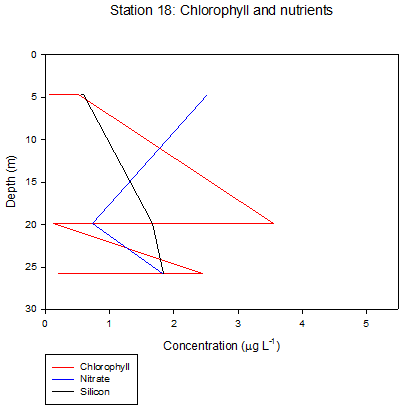
Figure 2.5. Vertical profile of the chlorophyll and nutrients (Nitrate and Silicon) concentration [ugL-1] vs depth (m) for station 17.
Station 16.
The fluorescence was recorded to a depth of 60m at station 16. The first reading at the surface was 0.05mg/m3 at 1.64m and from here it increased at a relatively steady rate to 0.12mg/m3 at 20m. Between 20m and 40m there was a strong double peak in fluorescence with an average of 0.42mg/m3 at between 25m and 35m. From 40m (0.06mg/m3) to 60m the fluorescence maintained a stable value of around 0.05mg/m3 for rest of the profile. The fluorescence peak corresponds to the depth of the chlorophyll maximum.
Station 17.
For station 17 the fluorescence was recorded to a depth of 66.3m. An initial slight increase in fluorescence from 0.03mg/m3 to 0.05mg/m3 occurred between 0.7m and 10m respectively. Aside from this slight increase, the fluorescence profile produced a constant value of around 0.06mg/m3 for the most of the water column bar a large peak between 25m and 35m, which a had fluorescence peak of 0.79mg/m3 at 30m. The maximum fluorescence depth was found to be within the same region as the chlorophyll depth maximum.
Fluorescence:
Station 18.
At station 18 the fluorescence was recorded to a depth of 28m. From the surface (0.7m) to 15m the fluorescence increased at stable rate from 0.02mg/m3 to 0.11mg/m3. From 15m to 25m there was a further rate increase from 0.11mg/m3 to 0.35mg/m3 respectively and then it abruptly dropped back to 0.11mg/m3 at 28m. The shape of this profile once again matches that of the chlorophyll maximum.
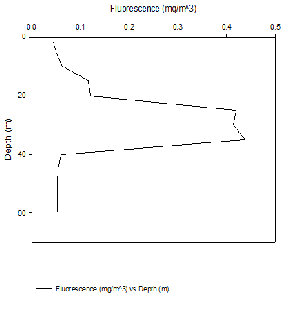
Figure 2.10. Vertical profile of fluorescence [mg/m3] vs depth (m) for station 16.
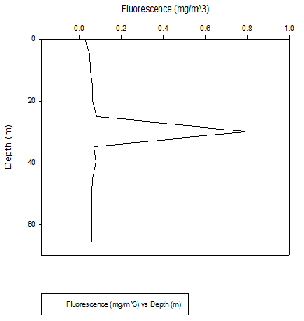
Figure 2.11. Vertical profile of fluorescence [mg/m3] vs depth (m) for station 17.
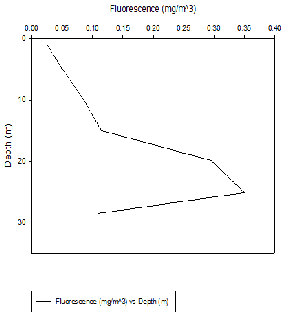
Figure 2.12. Vertical profile of fluorescence [mg/m3] vs depth (m) for station 18.
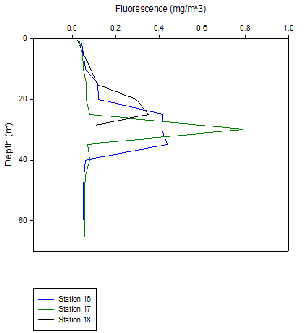
Figure 2.6. Vertical profile of chlorophyll [mg/m3] vs depth (m) for all stations.
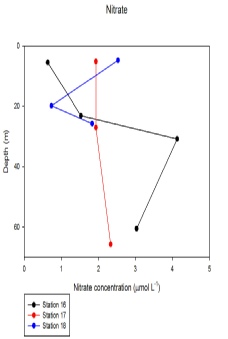
Figure 2.7. Vertical profile of nitrate [mg/m3] vs depth (m) for all stations.
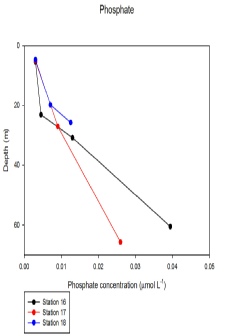
Figure 2.8. Vertical profile of phosphate [mg/m3] vs depth (m) for all stations.
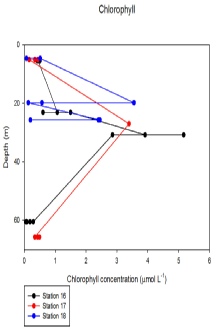
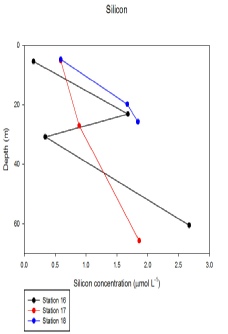
Figure 2.9. Vertical profile of silicon [mg/m3] vs depth (m) for all stations.
Figure 2.13. Vertical profile of fluorescence [mg/m3] vs depth (m) for all stations
| Biological |
| Chemical |
| Physical |
| YSI Probe |
| Current Meter |
| Chlorophyll |
| Sidescan Sonar |
| Underwater Video |
| Poster |
| Biological |
| Chemical |
| Physical |