


All the information shown on this website are our own views and not those of the NOCs or the University of Southampton


Metadata.
The Fal estuary is a prime example of a ria formation. Due to rising temperatures during the Pleistocene - Holocene transitional period, it caused the melting of glaciers (≈18 000 years ago), the rising water levels drowned the river valleys, leading to the deep channels of the River Fal and its associated tributaries. The surrounding waters remain much shallower than these channels and become exposed sandy and muddy sediments during lower tides.[1]
As estuaries mark the point where freshwater meets seawater, the biological, chemical and physical properties of the water column can change quickly over time and space. The objective of this survey was to investigate how these variables change with distance in the Fal estuary and investigate the factors that govern these variables.
During the morning of 30th June, samples of the estuary were taken on board the vessel RV Bill Conway at six different locations, gradually moving up-river with each sample to match the incoming tide. At each location samples were collected at three different depths in order to see how the properties of the estuary change with depth, along with distance from the sea. Two of the locations were in areas deemed too shallow for three depth samples to be collected, in these instances two were collected.
ESTUARY
|
Date: |
30/06/2015 |
|
Locatiion: |
Station 55 - 50⁰10.165 N 005⁰02.303 W Station 56 - 50⁰12.075 N 005⁰02.446 W Station 57 - 50⁰12.455 N 005⁰010.701 W Station 58 - 50⁰13.331 N 005⁰01.613 W Station 59 - 50⁰13.520 N 005⁰00.915 W Station 60 - 50⁰14.391 N 005⁰00.879 W |
|
Weather: |
Sunny. Cloud cover 1/8. |
|
Water depth: |
Station 55 - 28.0 m Station 56 - 14.6 m Station 57 - 5.5 m Station 58 - 12.7 m Station 59 - 13.7m Station 60 - 5.4 m |
|
Average wind speed: |
Station 55 - 7.5 m/s Station 56 - 8.8 m/s Station 57 - 2.3 m/s Station 58 - 5.2 m/s Station 59 - 1.9 m/s Station 60 - 3.7 m/s |
|
Average wind direction: |
Easterly winds |
|
Tide: |
High - 17:16 UTC (5.10m) Low - 11:33 UTC (0.90m) Neaps |
|
Vessel: |
R. V. Bill Conway |
A number of variables were recorded by this survey: temperature, salinity and current variability data were collected using a deployable YSI sonde; concentrations of Nitrate, Phosphate and Silicate, chlorophyll concentrations and dissolved oxygen (O2) concentration data were collected using a rosette array of Niskin bottles and processed on board for analysis in the onshore lab. Phytoplankton samples were collected from Niskin water bottles and zooplankton samples were collected using a net sampler pulled behind the vessel. A Secchi disk was used to record how turbidity changed throughout the estuary.
Field methodology.
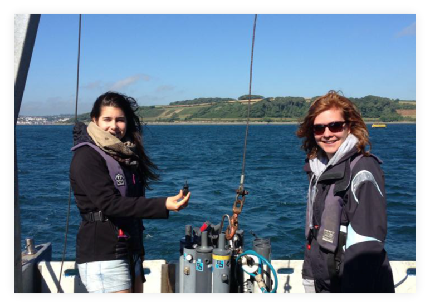
Image 5.1. Mir and Anna setting the rossette system to be deployed.
Introduction.
Phytoplankton
From the niskin bottle a sample of 100 ml was collected and mixed with Lugol’s iodine to preserve the sample.
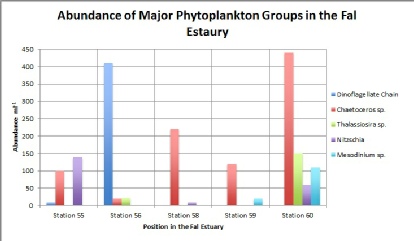
Figure 5.1 shows how the characteristics of the water column affect the dominance and abundance of the major groups. Firstly it is visible that Dinoflagellates are only present at station 56 (400 cells per ml). Samples at this station were collected from the lower parts of the estuary, where the salinity is higher and there is less turbulence within the water column. The reason why Dinoflagellates are not found in the upper parts of the estuary is because they show optimum growth where the flow is laminar and the salinity is higher. In contrast to this, Thalassiosira species shows greatest abundance at station 60 (150 cells per ml), which was in the upper parts of the estuary. At this location the salinity of the water would be lower and there is high turbidity. However this species shows the ability to survive in different conditions as it is also present at station 56 where the salinity is higher. The same pattern is shown is shown for the Mesodinium species where its greatest abundance is found at station 60 (110 per ml), however this species is still present at station 55 (10 cells per ml) and at station 59 (20 cells per ml). The difference in the characteristics of the water between these two locations means that this species has a high tolerance to changes in salinity. Chaetoceros species shows a consistent abundance throughout the whole estuary and is dominant in 3 out of the 5 stations. However its greatest abundance is present at station 60 (440 cells per ml), suggesting that although it can survive in all conditions the species thrives best in environments which are fresh water dominated. Finally the species Nitzschia shows greatest abundance in the lower part of the estuary at station 55 (140 cells per ml). Small traces of it was found at station 58 (5 cells per ml) and a greater amount at station 60 (55 cells per ml). Once again showing that in order for phytoplankton to survive in estuaries they must be able to adapt to the continuously changing conditions.
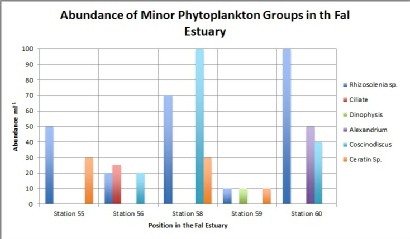
Figure 5.1, shows the five stations at which we sampled phytoplankton (55, 56, 58, 59 and 60) with 60 being the furthest up the estuary towards Truro whereas 55 was located at the mouth of the estuary, towards Falmouth. The first thing we notice from figure (abundance of minor phytoplankton groups in the Fal estuary) is that minor phytoplankton groups such as Rhizosolenia sp. decrease in abundance as we progress down toward the mouth of the estuary decreasing from 100 cells per ml-1 at station 60 to 50 cells per ml-1 at station 55. This therefore suggests that Rhizosolenia prefer fresh water conditions. Having said this though, station 59 shows the lowest count for Rhizosoleni (10 cells per ml) with station 56 also seeing a lower than expected count of 20 cells per ml.
This is opposed to Ceratin sp. seen here to increase as you progress down the estuary with 30 cells per ml-1 found at station 55 and only 10 cell per ml-1 found at station 60, our furthest point up the estuary. This in turn, suggest that Ceratin prefer more saline conditions, yet, having said this, there were no Ceratin species recorded for station 56. This could be an anomaly as all of temperature, salinity and depth are in accordance with the other stations.
Furthermore, Ciliate and Dinophysis species are only found at stations 56 and 59 respectively (25 cells per ml for Ciliate at station 56, and 10 cells per ml of Dinophysis at station 59). These results suggest that Dinophysis species prefer fresher waters as are found further up the estuary, whereas Ciliate species prefer more saline waters as are found towards the mouth of the estuary.
The conclusions drawn from the phytoplankton may be limited through the impact of human error during the identification process in the biological lab the following day. In addition to this, the amount sampled was only a very small subsection estuarine water. Therefore any rarer species may well have been missed out through lack of repeat or larger samples. One the other hand, any species counted may well have been multiplied up to over exaggerate their abundance within the estuarine waters. Station 57 was not sampled for phytoplankton due to the lack of sampling bottles containing Lugols iodine.
Zooplankton
This was collected by carrying out a horizontal transect over a period of 5 minutes. When the net was first deployed the start Lat and Long was recorded, it was then towed behind the vessel for a period of time, with the ACDP measuring the rate of flow through the net. When the transect was finished the Lat and Long was recorded again.
Figure (abundance of minor zooplankton) shows the minor zooplankton groups along the Fal Estuary. The samples for station 55 were taken at the mouth of the estuary, station 57 at the mid-region of the estuary and station 60 as far up stream as possible. There was an overall clear decline in species abundance and diversity as you went further up the estuary. All species bar the polycheate larvae, which showed a peak abundance in the mid estuary (station 57), displayed smaller populations further upstream (station 55).
Figure (abundance of major zooplankton) illustrates the major zooplankton groups along the Fal Estuary from the stations 55, 57 and 60. The same trend is observed in the major zooplankton groups with a reduction in species population and diversity in the higher regions of the estuary. All species, excluding Copepoda Nauplii, which revealed a peak abundance in the mid estuary (station 57) peaked in abundance lower in estuary (station 55). The major dominant zooplankton group was Copepoda, which was twice as abundant as the next most populous group at all three stations within the estuary.
Figure 5.1. Google Earth’s caption of the 6 transects at the Fal estuary.
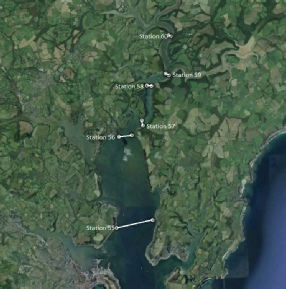
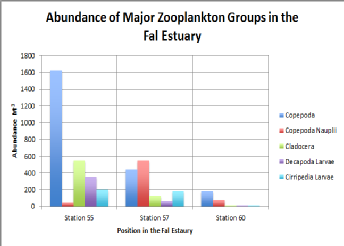
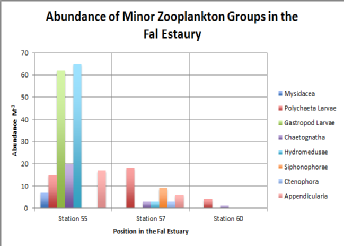
Figure 5.3. Abundance of Major Zooplankton Groups
Figure 5.4. Abundance of Minor Zooplankton Groups
Figure 5.1. Abundance of Major Phytoplankton Groups
Figure 5.2. Abundance of Minor Phytoplankton Groups
CONCLUSION.
From our various samples collected in the Fal estuary, we were able to create estuarine mixing diagrams where we plotted nutrient concentrations (silicon, nitrate and phosphate) against salinity. This allowed us to obtain an overview of the conditions in the Fal estuary and the mixing that was taking place. Furthermore, by comparing concentrations to the theoretical dilution line, we could infer about processes taking placing concerning the removal or addition of nutrients. Phytoplankton utilise silicon, nitrate and phosphate for growth, which explains the removal observed. The numerous rivers that feed into the Fal estuary input large amounts of fresh, riverine water that act as nutrient sources. There is also a lot of anthropogenic activity in the Fal estuary that will have an effect on how nutrients behave, although it will be difficult to separate these elements from other natural processes. Phytoplankton was most abundant at station 60, the most upriver station sampled. Phytoplankton species distributions are related to the temperature, salinity and nutrient concentrations as each species has its optimum, ideal conditions. Zooplankton is more dominant in the lower parts of the estuary as they favour the more marine environment.
REFERENCES.
Murrel, M. C. (2004), ‘phytoplankton And Zooplankton Seasonal Dynamics In A Subtropical Estuary: Importance of Cyanobacteria. Journal of Plankton Research 26(3), pp.371-382. Web
Lance, J. (1963). The salinity tolerance of some estaurine planktonic copepods. Limnology and Oceanography , 440-449.
Jorgensen, B.B. and Richardson, K. 1996. Eutrophication in coastal Marine Ecosystem. Coastal and Estuarine studies, 52.
Wooldridge T. and T. Erasmus 1980. Utilization of tidal currents by estuarine zooplankton, Estuarine and Coastal Marine Science, 11, 107-114
| Biological |
| Chemical |
| Physical |
| YSI Probe |
| Current Meter |
| Chlorophyll |
| Sidescan Sonar |
| Underwater Video |
| Poster |
| Biological |
| Chemical |
| Physical |