


All the information shown on this website are our own views and not those of the NOCs or the University of Southampton


PHYSICAL LABORATORY.
Temperate and Salinity
ADCP.
Station 16
For station 16 the temperature and salinity was recorded to a depth of 60m. From the surface reading (1.64m) to 40m the temperature decreased with depth at a relatively steady rate from 14.68°C to 11.68°C respectively. From 40m to 60m the temperature remained constant, staying around 11.66°C. The salinity showed a slight decrease from the surfacing reading to 15m of 0.11 from a salinity of 35.35 to 35.24, which could have been attributed to evaporation at the sea surface. It then increased again back to 35.31 at 35m and plateaued off at this value till 60m.
Station 17
Temperature and salinity were measured to a depth of 66.3m at station 18. From the surface (0.69m) to 5m the temperature dropped sharply from 22.51°C to 15.55°C and then from 5m to 30m the temperature decreased at a slower rate from 15.55°C to 11.57°C, to where it then plateaued off at 11.4°C for the rest of the profile. The surface salinity reading was 31.84, then it decreased to 35.3 at 5m and plateaued off for the rest profile. The higher temperature at the surface was probably due to solar heating and the fresher layer of sea surface water was most likely influenced by fresh water output from the Fal Estuary.
Station 18
Station 18 was profiled to a depth of 28.6m. The temperature showed the fastest rate of decline from the surface (0.65m) to 10m: from 14.94°C to 13.52°C. The rest of the temperature profile revealed a gradually declining rate of temperature decrease down to 28.6m, with a reading of 12.58°C. The salinity remained constant throughout the water column with an average reading of 35.26.
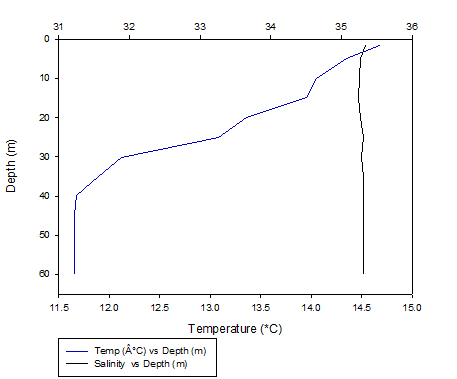
Figure 2.17. Vertical profile of the chlorophyll and nutrients (Nitrate and Silicon) concentration [ugL-1] vs depth (m) for station 16.
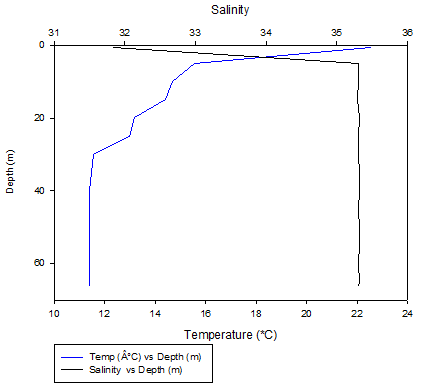
Figure 2.18. Vertical profile of the chlorophyll and nutrients (Nitrate and Silicon) concentration [ugL-1] vs depth (m) for station 16.
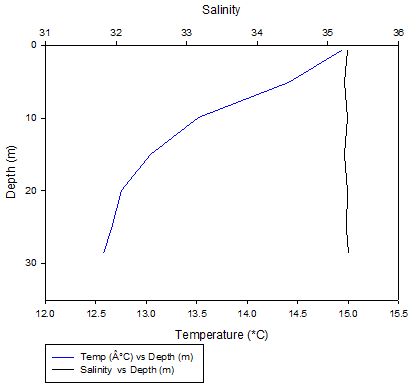
Figure 2.19. Vertical profile of the chlorophyll and nutrients (Nitrate and Silicon) concentration [ugL-1] vs depth (m) for station 16.
CTD.
Station 16:
Flow at this station is fastest at the surface, with flow is the first 15m reaching velocities of between approximately 0.1 m/s and 0.2 m/s. Deeper waters show a very small flow, reaching velocities between 0.1 m/s and 0.001 m/s. This trend is continuous with distance on the transect.
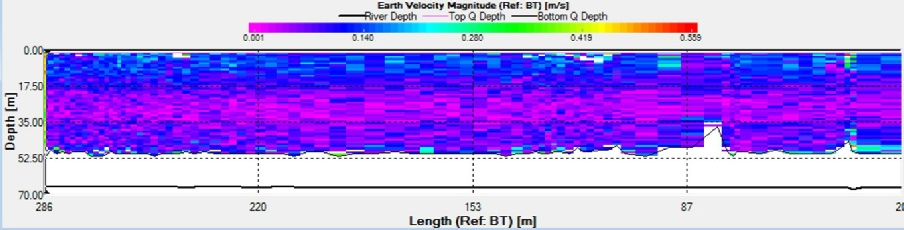
Figure 2.14. Vertical profile of fluorescence [mg/m3] vs depth (m) for station 16.
Station 17:
Flow at this station shows two clear layers of faster flowing
water from the surface to 5m and approximately 30 – 35m. This is likely due to wind
generated currents at the surface and either a thermocline with an associated layer
of plankton generating backscatter or the presence of internal waves. Current between
these areas is mixed and shows no clear trends.
Station 18:
Flow at this station shows little trend with depth or distance. The water column is shallower and closer to the influence of the Fal estuary. This shallower water body is also heavily affected by shipping traffic and weather and thus this water column is more thoroughly mixed than the other stations sampled.
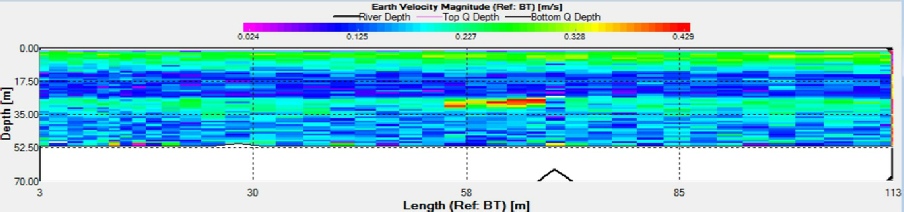
Figure 2.15. Vertical profile of fluorescence [mg/m3] vs depth (m) for station 16.
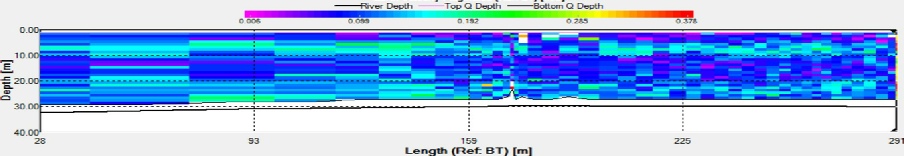
Figure 5.16. Vertical profile of fluorescence [mg/m3] vs depth (m) for station 16.
| Biological |
| Chemical |
| Physical |
| YSI Probe |
| Current Meter |
| Chlorophyll |
| Sidescan Sonar |
| Underwater Video |
| Poster |
| Biological |
| Chemical |
| Physical |