
Disclaimer: These findings are the personal interpretation of the students involved and do not reflect the views of the University of Southampton, the National Oceanography Centre or Falmouth Marine School.


Throughout the Falmouth 2013 Field trip, each group visited the King Harry Pontoon on various days to collect data, which was then collated together, in order to obtain a time series of results.
On the pontoon, we used a YSI probe, Secchi disc, light meter and a current meter. Unfortunately for our group, on our designated day (Monday 1st July) the current meter broke and we were unable to gather information for current on this day. However, this data set was collected in the middle of a time series. Only this groups data is used for the analysis completed below.
Contour plots were created based on measurements taken from the pontoon and depict how physical and chemical properties of the estuary change with tidal phases. Data was collected every half an hour between 0845 UTC and 1215 UTC and were interpolated by SigmaPlot software in between measurements; therefore, interpretations may lack in accuracy but show general trends.
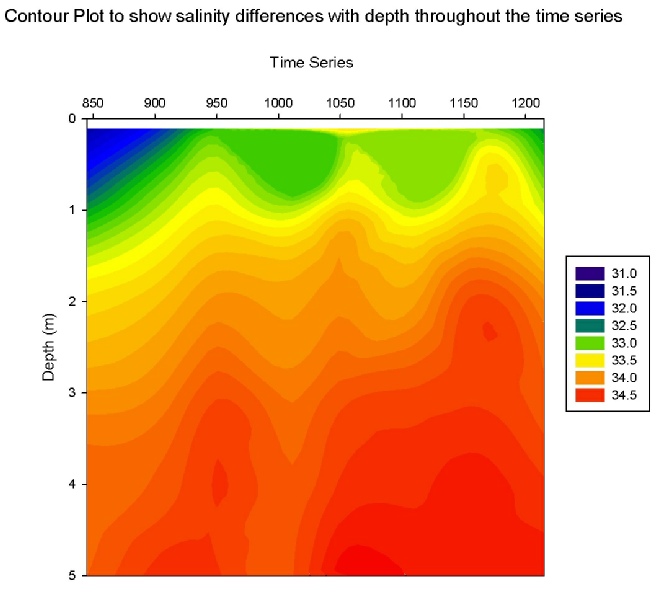
Salinity
The vertical salinity profile (fig. 1) shows weak stratification. A layer of fresh water was recorded between 0 and 1.5 meters, of 33.0 on average, and it is seen to flow over the more salty water of 34.5, which is recorded between 3 and 5 meters. The lowest salinity, 30.9, was recorded at 0.178m at 1015 UTC. A gradual increase in salinity with time was observed at shallow depths between 0 and 1.5 meters.
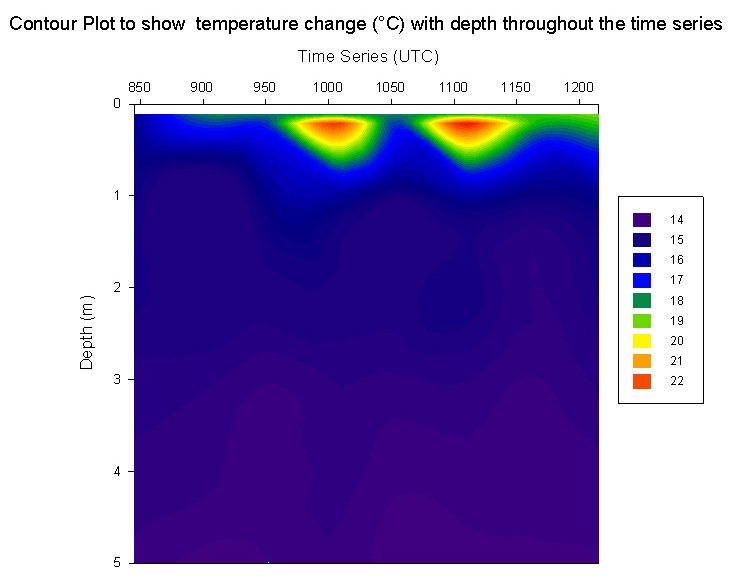
Temperature
Figure 2 shows that only the top metre of the water column is being affected by an increase in solar radiation. Between 1 and 5 meters temperature has a constant value of 14oC degrees. The warmest temperatures were recorded at the surface at 1015 and 1115 UTC of ~22°C.
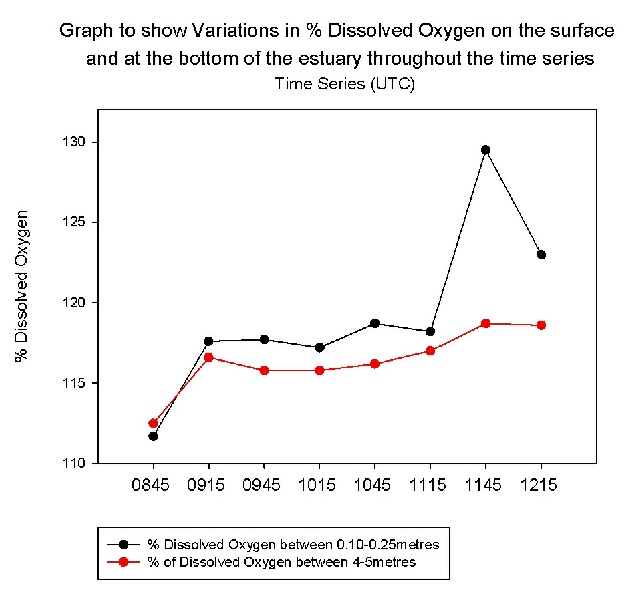
Dissolved Oxygen
Figure 3 illustrated the variation in dissolved oxygen (DO) and shows that DO saturation increases with time. Within a top layer the increase is more rapid and it reaches the highest value of 130% at 1145 UTC. The increase in values may be assigned to biological activity – photosynthesis during the day has a major contribution to the amount of dissolved oxygen in the estuary.
Conclusion
Analysis of figures 1 and 2 allows the statement that at the pontoon, influence of both sea and riverine water on both the chemical and physical properties is visible - riverine water, which is warmer and less saline, flows over the saltier and colder seawater due to it being less dense. Increase in solar radiation with time causes a rise in surface temperatures as well as stimulating photosynthesis, which in turn increases the oxygen saturation of the water.
Light Penetration
The graph for 1% light penetration (fig. 4) shows a peak at just after 1000 UTC detected by the light meter, where the light penetrates to only approximately 7.5m depth, the shallowest for the duration of the time series. The Secchi disc readings did not mimic the results obtained by the light meter as the readings were fairly stable throughout the day until after 1100 UTC when the light penetration increased by about 1m.
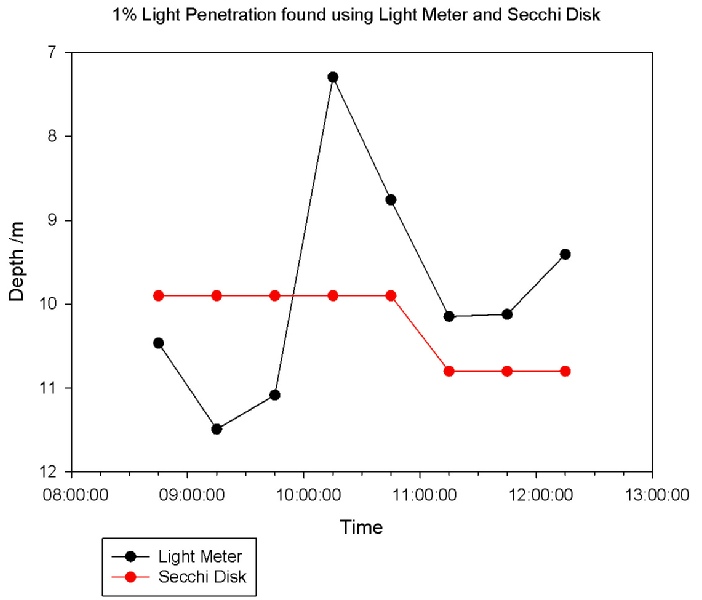
Figure 1
Figure 2
Figure 3
Figure 4