
Disclaimer: These findings are the personal interpretation of the students involved and do not reflect the views of the University of Southampton, the National Oceanography Centre or Falmouth Marine School.


Physical Factors
Interpretations
ADCP
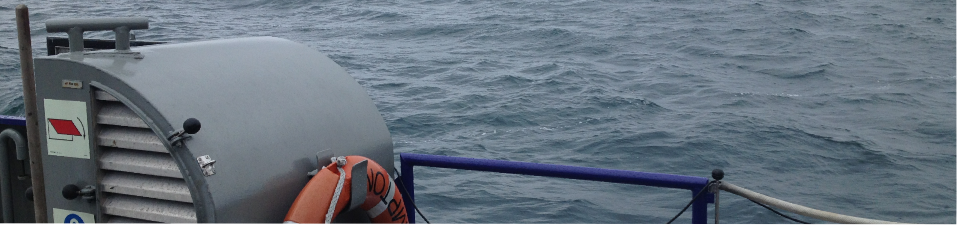
Figure 1 shows the front bringing in the higher levels of Phytoplankton and Zooplankton that strive off the nutrient rich waters carried with the front. It also shows the turbulent surface layers that could have been responsible for that fact it was not possible to detect the tidal front using the surface readings of the ADCP.
CTD
These results display the differences in vertical structure in front and behind the tidal front, with stations 1, 3, 4 and 5 being in between the front and the coast, while station 2 is behind the front.
The water columns behind tidal fronts are typically far more stratified than the well mixed waters in front. Our data correlates well with this statement, as station two has a far more prominent thermocline (fig 2) that is far less obvious in the more well mixed waters.
The chlorophyll concentration of station 2 (fig 3) also shows a larger chlorophyll maximum that stretches over a greater depth. This supports the theory that station 2 sampled waters past the tidal front, as the increase in chlorophyll correlates with the increased absorbance at depths of 10-20m shown in the ADCP transect. This absorbance is caused by blooms of phytoplankton and zooplankton that thrive on the nutrient rich waters brought in by the tidal front.
Comparing the temperature profiles from station 5 with group 1’s (fig 4, Station 2) data from the same point taken on the 24th of June can reveal how the vertical profiles may have changed over 10 days and whilst under more intense weather condition. As Group 1 sampled this area at 11:24 UTC and the data from Station 5 was sampled at 12:06, the difference in sampling time from the two dates must be taken into consideration.
Both profiles display the temperature decreasing steadily with depth, with no distinct thermocline. However the sample taken by group 1 has an initial surface temperature 1.6oC cooler, reaching a minimum temperature of 10.5, whereas the profile from group 6 reaches a warmer minimum of 12.2oC. This difference in temperature recorded could be down to the build of the summer thermocline over the 10 days in-between group 1 and group 6’s samples at this point. The surface layer from group 6’s data shows signs of turbulent mixing, most likely due to the strong winds present on the day of sampling, whereas the data from group 1 has far smoother surface data, that represents the calm but cloudy weather conditions recorded at this time.
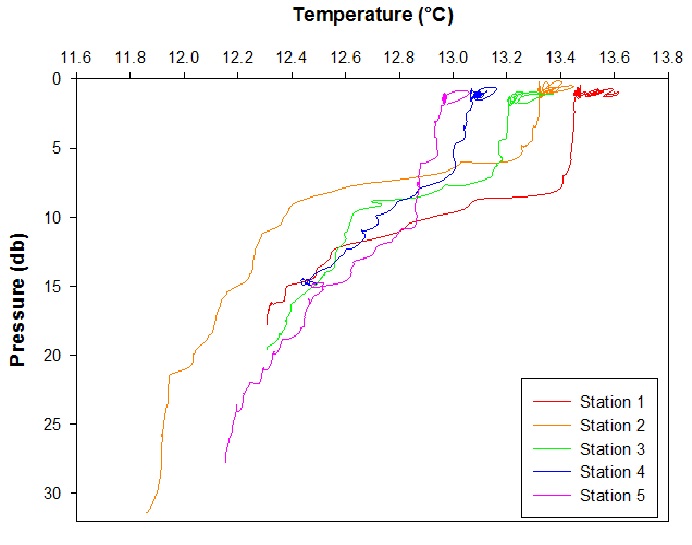
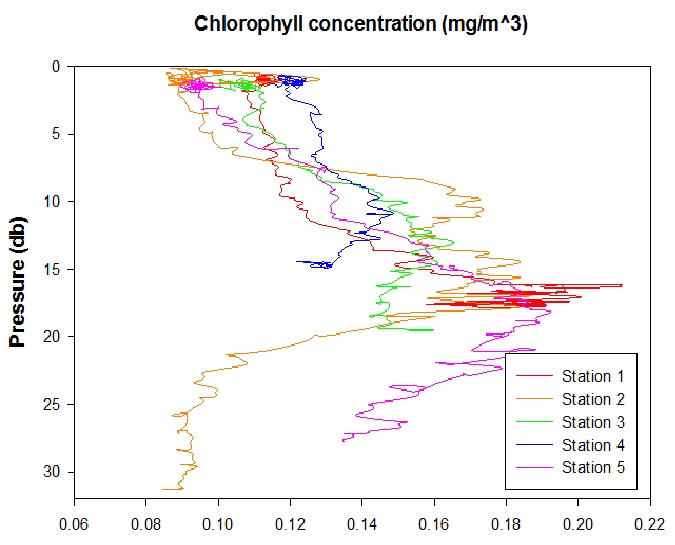

Figure 1
Figure 2
Figure 3
Figure 4
Richardson Number
The Richardson Number (Ri) is a dimensionless ratio between the change in density and velocity shear (magnitude and direction) with depth and can be calculated using the following equation (Knauss, 1997).
Ri=g(dp/dz)/(p(du/dz)^2)
Where g is gravitational acceleration, dp/dz is change in density with depth, p is average density in the water column, and du/dz is change in velocity with depth.
Typically, Ri 1<0.25 describes turbulent flow, Ri>1 describes laminar flow and an Ri number in-between these values expresses gravitational shear.
Ri values observed at Station 1 (fig 5) down to 8m depth were below 0.1 suggesting mixing is occurring in the upper warmer layer of the water column. At depth 9m and 16m the values increased to above 1 (1.27, 5.06) indicating a stable layer, this is probably due to the location of Station 1 being quite close to the tidal front.
Station 2 (fig 6) is located behind the front, showing a clear thermocline in the water column. This is supported by the Richardson Number calculations. The Ri values indicated mixing occurred within the top 6m with a high Ri value occurring at 7m (2.89) signifying the start of the thermocline. The highest Ri value is found at depth 19m (24.10).
The water column at Station 3 (fig 7) is quite well-mixed despite the Ri values calculated from depth 8m to 12m indicating mixing by shear instability with values falling between 0.25 and 1 (average of 0.802). This may due to the location of Station 3 also being close to the tidal front.
Station 4 (fig 8) is very close to shore with a well-mixed water column with almost all the Ri values smaller than 0.25. This indicates that velocity shear at Station 4 is strong enough to overcome the stratification of a body of water and enable mixing to occur.
The situation is similar for Station 5 (fig 9). Ri values observed at Station 5 are all less than 0.01 indicating unstable flow with the temperature remaining within the range of 0.8°C throughout the depth sampled.
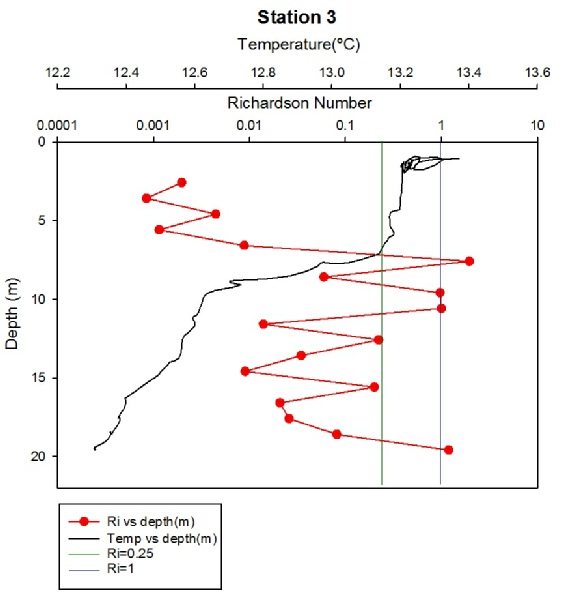
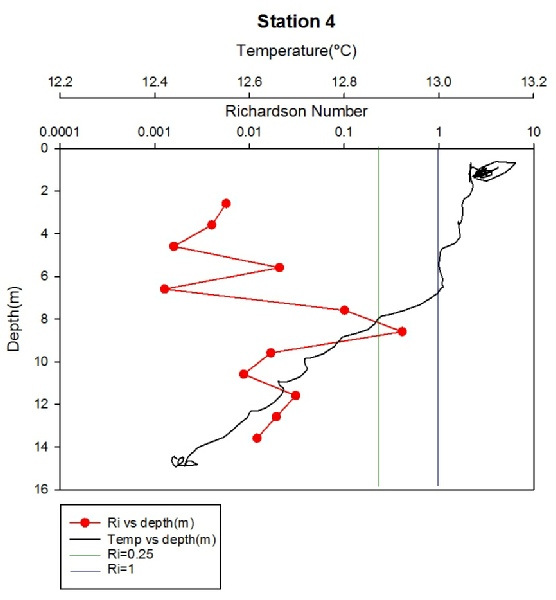
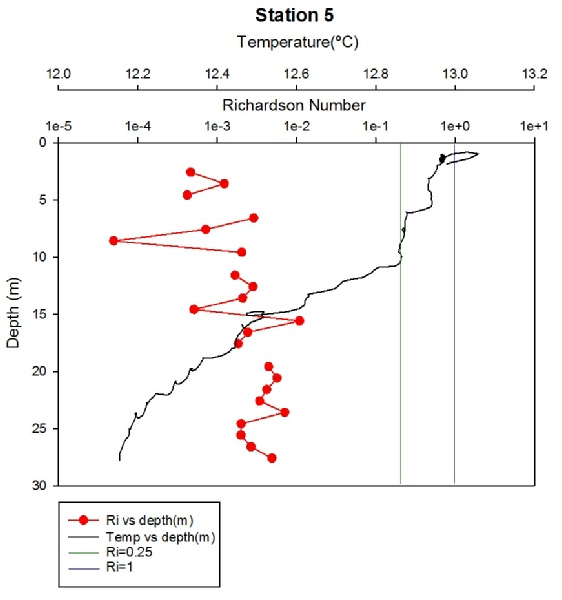
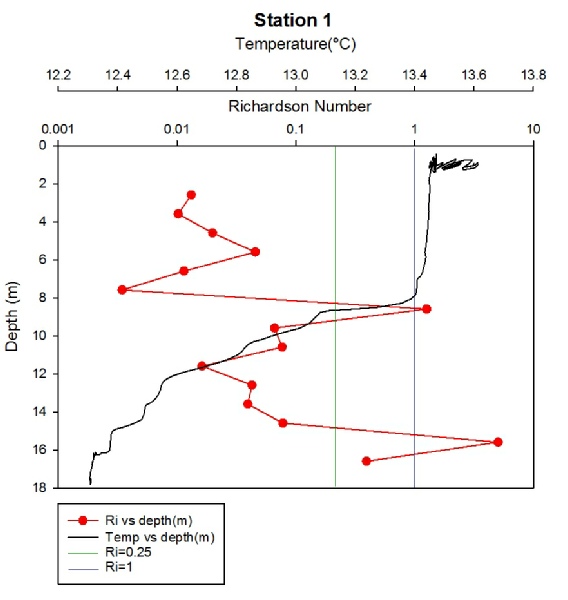
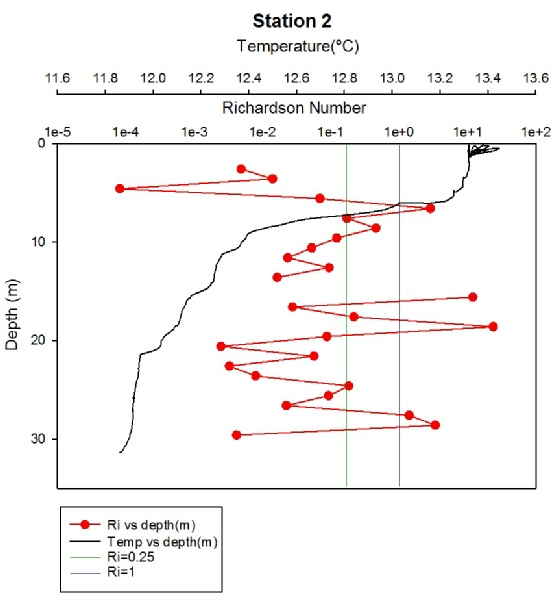
Figure 5
Figure 6
Figure 7
Figure 8
Figure 9