
Disclaimer: These findings are the personal interpretation of the students involved and do not reflect the views of the University of Southampton, the National Oceanography Centre or Falmouth Marine School.


Chemistry of the Open Ocean
Silicon
Figure 12 shows the silicon concentrations from stations 1 and 2 decreasing slightly with depth, whereas station 3 shows no change between 2m and 13m. Station 2 has the greatest change, with an overall increase of 3.8µmolL-1 by 25m. Station 5 appears to be an anomalous result that has been ignored.
A potential cause for the patterns portrayed by stations 1 and 2, is the presence of phytoplankton at the boundary front between the two water masses (~ 13m deep). Above the boundary layer, warmer, nutrient poor waters can be found. This is due to light being able to penetrate through the surface waters increasing the temperature. Prior phytoplankton productivity during the spring bloom would have stripped surface waters of the nutrients. Therefore phytoplankton have migrated to the boundary layer, where light is able to penetrate through the water but is still deep enough for the upwelling of colder, nutrient rich waters below the boundary layer to be utilised. Upwelling from this water mass provides the phytoplankton enough nutrients to enable them to survive at this depth. Due to light being unable to penetrate past the boundary layer, a colder environment is set up where phytoplankton are incapable of living. Therefore nutrient concentrations increase in this area, which can be observed by the station 2 plot.
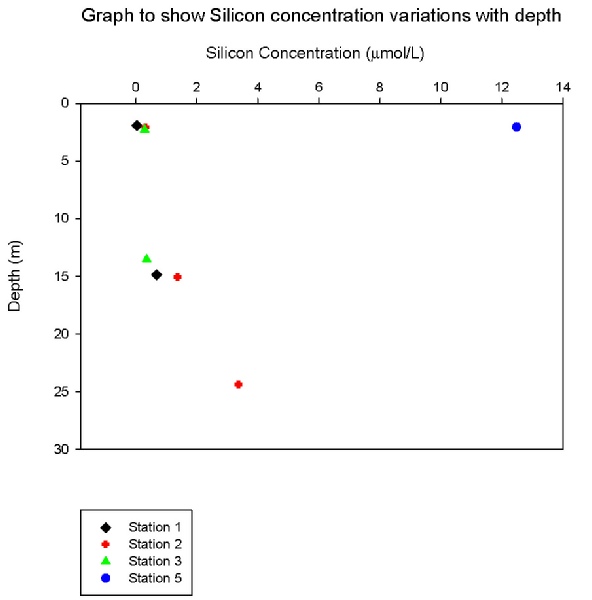
Figure 12
Phosphate
Figure 11 shows stations 1, 3 and 5 decreasing with depth, whereas station 2 decreases with depth to 15m before increasing by 25m. This deviation could be down to the increased plankton levels caused from the tidal front, as the increased plankton levels determined from the ADCP and CTD data at station two coincides with the depths of phosphate minimum. As the plankton levels increase, they use greater amounts of nutrients such as phosphate. Due to the strong stratification this does not occur at greater depths and therefore phosphate levels remain higher.
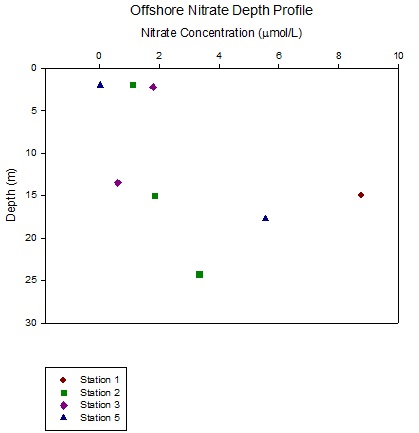
Figure 10
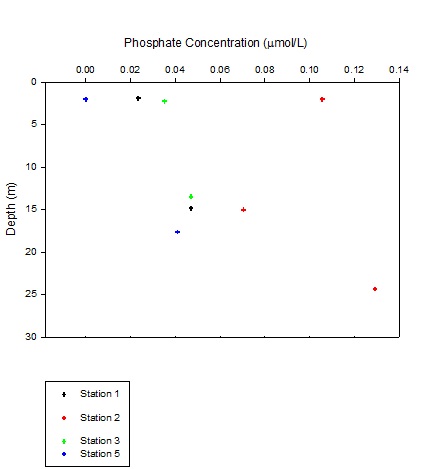
Figure 11
Chlorophyll
Stations 1 and 5 showed an increase in chlorophyll with depth by about 2.5 to 3μg/L over about an increase of 15m (Figure 13). Station 3, however, displayed a decrease in concentration from just over 5μg/L at the surface to almost 3μg/L at 15m and then decreased to just over 2μg/L at 25m. Stations 3 and 5 may have a different trend in concentration with depth compared to stations 1 and 2 as the samples were taken deeper in the water column from about 25m to 45m.
Stations 1 and 5 showed an increase in chlorophyll concentration from the surface
to about 15m depth of about 2μg/L and 3μg/L respectively, whilst station 3 showed
a decrease by approximately 2.5μg/L within the first 15m. Station 2 displayed an
increase of almost 2μg/L before decreasing 4μg/L to make the concentration just over
2μg/L at 25m.
When comparing these results to those of phytoplankton abundance, some
correlation would be expected but this is not the case. This could possibly be because
the study of phytoplankton in a lab included analysing a 10ml sample and using the
results from it to calculate the abundance of phytoplankton within 1m³ of seawater,
which is not an accurate representation of the phytoplankton distribution and abundance
around the station in reality. It is likely that our sampling or analytical techniques
included error; otherwise these results would be indicative of a well mixed water
column at each station.
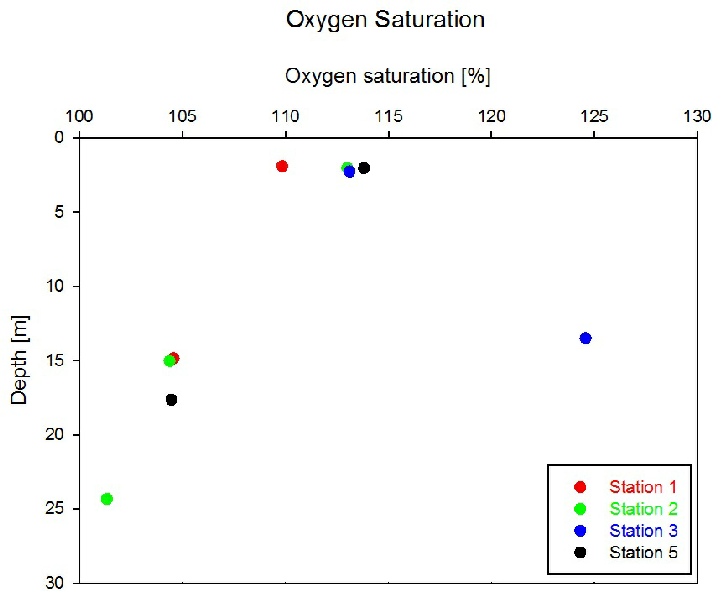
Figure 14
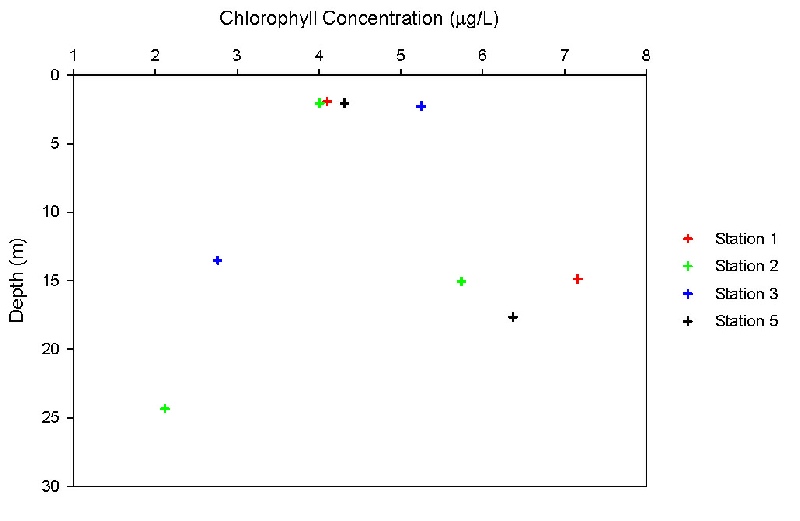
Figure 13
Dissolved Oxygen
Methods
Winkler method was used to analyse saturation of analysed water columns at specific stations (1, 2, 3, 5). Samples were collected from three depths at station 2 and two depths at stations 1, 3 and 5 using Niskin bottles. Samples were stored in the glass stoppered bottles to minimise the exposure to the open atmosphere, preventing contamination of the samples.
Interpretation
From the surface samples, the highest saturation (113%) was at Station 3, and the lowest saturation (104%) was at station 1 (Figure 14). The lowest overall oxygen saturation was measured in the deepest sample at Station 2 (101%). Samples collected at Stations 1, 2 and 5 suggests that oxygen saturation decreases with depth. The oxygen minima for each station coincides with the nutrient maxima, as expected. The sinking POM from the surface stratified water would increase the nutrient concentrations with depth; however the lack of mixing below the thermocline prevents oxygen reaching the deeper waters. At the surface, water is better saturated due to the on-going exchange with the atmosphere, at depth – oxygen is being consumed resulting in the minima, and nutrients are released reaching their maxima (close to the thermocline depth).
Increase in values observed at Station 3, shows the opposite trend, possibly caused by local anomaly or human error. It could also be due to the high winds, increasing mixing in the surface waters, possibly slightly breaking down the thermocline, allowing some mixing of oxygen into the deeper water. As the station with the least depth, this would have a greater affect than at other stations. Station 3 also has a shipwreck nearby which could result in a communities increasing primary productivity in this area.
Nitrate
Figure 10 shows stations 2 and 5 increasing in nitrate concentration with
depth while Station 3 decreases with depth. Station 1 shows no such trend as the
surface value was removed after being deemed an anomalously large value of 184.37μmol/L.
Although there are few data points, it is clear Station 1 had the highest concentration with 9μmol/L of nitrate at 15m.This could be due to the output flow of the estuary that contains large amounts of nitrate from the sewage effluent nearby and the agricultural waste leached into the rivers Allen and Kenwyn that feed into the estuary.