Disclaimer: These findings are the personal interpretation of the students involved and do not reflect the views of the University of Southampton, the National Oceanography Centre or Falmouth Marine School.

Phytoplankton
Method
Samples were taken from stations 1, 3, 4, 6, and 7 along the Fal Estuary. They were collected from the surface Niskin bottle samples at each site. They were put into dark collection bottles with a small amount of Formalin to preserve the samples. They were kept in the dark to prevent any change to the samples between collection and identification in the lab the following day.
Interpretation
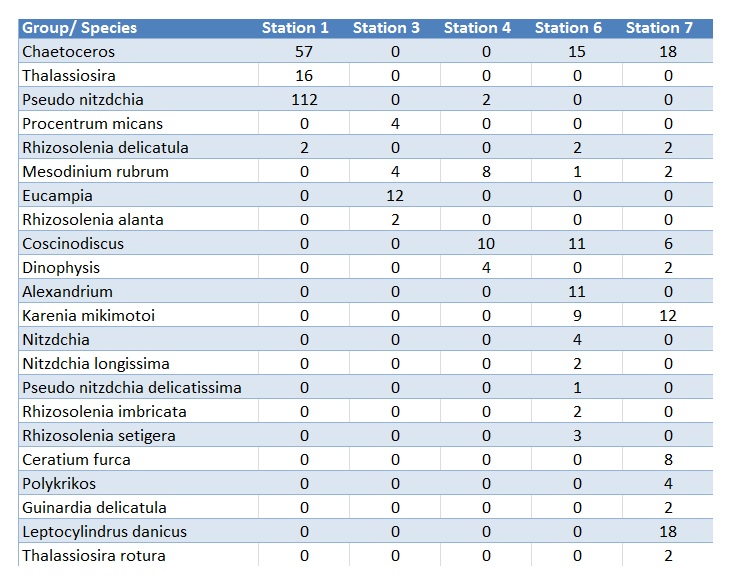
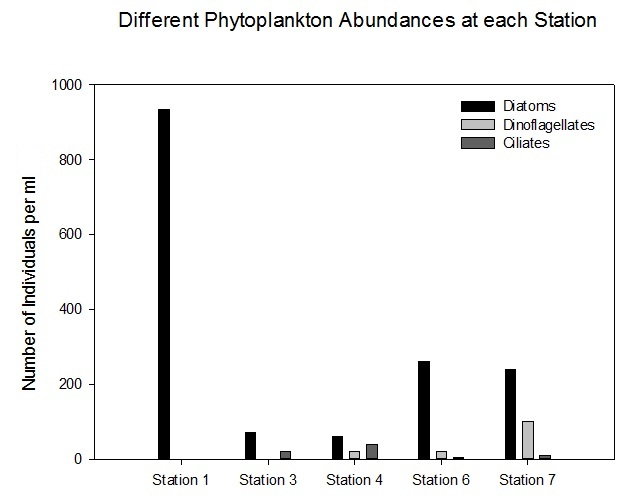
From looking at the data (table 1) it is clear that the biodiversity of phytoplankton changes with position along the estuary. The biodiversity is greatest further up the estuary at stations 6 and 7, and is lowest at the earlier stations, with 11 different species as opposed to 4 different species. Station 1 is where the greatest total number of phytoplankton was found, with 244 individuals identified in a 0.2ml sample under a high power light microscope. This location however also had the lowest biodiversity observed with only four different species being identified. This could be due to the water further down in the estuary having unfavourable conditions that allow only a few species to thrive as the salinity may be too high for some high salinity intolerant individuals at 34.8(highest recorded salinity). Along the estuary, the concentration of dissolved gases such as oxygen, trace metal speciation and inorganic nutrients (nitrate, phosphate, silicate) all change, and their fluctuations are closely associated with fluctuations in phytoplankton photosynthesis and growth.
At station 1 the phytoplankton species were all diatoms (fig 17), and diatoms are present in nutrient rich waters and are their growth is less affected by wave action and turbulent waters. There are no dinoflagellates here however, as they cannot survive in the open and turbulent conditions of station 1 but are seen in abundance at the later, less mixed, stations. At the stations in the middle of the sampling range the biodiversity and total number of phytoplankton is low. This could be because of the nutrient levels limiting the growth. At stations 6 and 7 the biodiversity is at its greatest with 11 different species identified at each. At both of these stations dinoflagellates were the most abundant type of phytoplankton. Also diatoms and ciliates were present at both of these stations. The ciliates present, Mesodinium, have a symbiotic relationship with red algae which they rely on to survive. They are commonly seen in alongside Dinoflagellates, often forming red tides. The salinities are at their lowest at stations 6 and 7 with salinities of 29.8 and 27.3 respectively, allowing the high salinity intolerant species to grow. The nutrient levels in the water, especially nitrate, are also at their highest here, allowing for a maximal rate of growth, light conditions permitting, explaining the higher diversity in phytoplankton at these stations.
Biological Findings
Zooplankton
Method
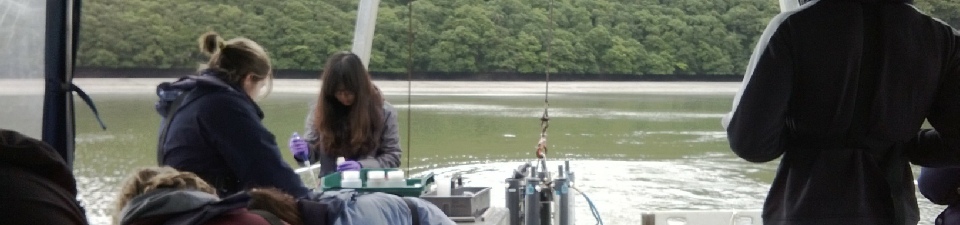
3 samples were collected from the estuary on Conway, taken from sites 1, 4 and 7 along the estuary. Samples were originally contained in 1litre bottles but when we came to identify the zooplankton the 1litre samples had been condensed into 500ml bottles, with 10ml from the new 500ml bottles equalling 20ml from the original 1litre sample bottles.
5ml of the sample was then pipetted into a 5ml Bogorov chamber and the sample was viewed under a high power light microscope. Individual zooplankton were identified with guides including detailed magnified pictures. This was then repeated once, giving a total sample size of 10ml per person.
The numbers of each individual zooplankton species were then calculated per of sample. The no. of each zooplankton species per of seawater can then be calculated by dividing this value by the amount of water that flows through the capture net (in ).
Interpretation
Station 7 appears to have higher numbers of most zooplankton groups identified, except in the case of Cladocera, Mysidacea and Polychaeta Larvae (fig 18). The most abundant groups for Station 7 are Copepoda, Copepoda Nauplii and Gastropod Larvae which are thriving further up the estuary. Unlike the phytoplankton data the zooplankton survey shows Station 7 to have the highest abundance and diversity, if they were identified correctly.
Since the majority of each station sample is made up of various forms of larvae, we can assume that the estuary is used as a form of nursery ground for invertebrates; the high levels of nutrients/prey and low predator count make the conditions ideal for larval development, especially up the estuary where station 7 is located.
The zooplankton does not show a gradual change up the estuary as one might expect it to; the station with the least abundance and diversity is Station 4 which is located mid-estuary. Station 1 has higher levels of zooplankton, though this does correlate with high abundance of phytoplankton, which is confirmed by high levels of chlorophyll found using the fluorometer and by measuring samples collected.
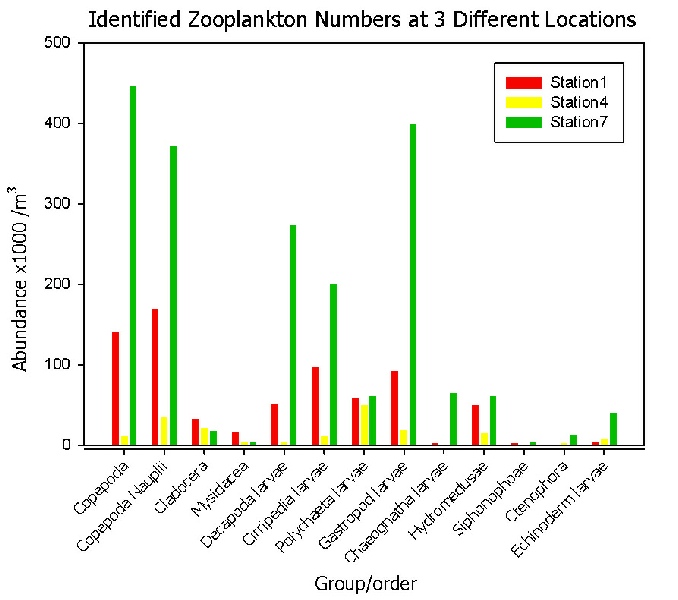
Figure 17
Figure 18
Table 1