Disclaimer: These findings are the personal interpretation of the students involved and do not reflect the views of the University of Southampton, the National Oceanography Centre or Falmouth Marine School.


Biological Findings
Phytoplankton
Results
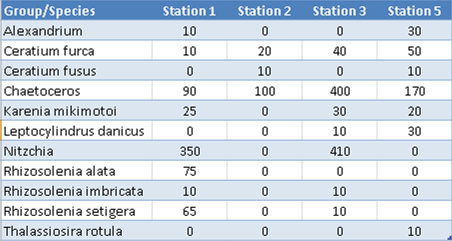
Different abundances of phytoplankton were found at each of the sampled stations. The station with the greatest number of specimens in a 1ml sub-sample was Station 3 at 13.50m depth, with 670 individuals. Station 3 had the highest number of specimens overall, with 910 found in two 1ml samples from depths of 2.26m and 13.50m. There were no phytoplankton found in the 1ml sub-sample from Station 2 at 15.03m, and the other depths (2.04m and 24.34m) yielded only 130 specimens overall in the two 1ml samples. Station 2 also had the most uniform depth profile in terms of phytoplankton abundance at each depth. The most diversity in species was found at 14.86m depth at Station 1, with 8 different species (570 specimens in 1ml in total), and Station 1 also showed the greatest difference in phytoplankton abundance between the surface and depth at >505.
The most abundant genera overall were the diatoms Chaetoceros and Nitzchia with 760 specimens for each. Both were most common at depth at Station 3, and together made up ~88% of the specimens found in the corresponding sample. The second most abundant species was the dinoflagellate Ceratium furca with 120 specimens. This species was most common at the surface at Station 5.
Interpretation
Station 2 was much further out to sea than the other stations, and this is reflected in the difference in phytoplankton abundance between them. The front can be assumed to be similar in location to a line joining Stations 1, 2 and 3, as the chlorophyll maximum in a frontal system is usually found on the very edge, following the pycnocline on the stratified side (Franks, 1992). Therefore, further away from the front there will be a decline in phytoplankton abundance. The phytoplankton maximum at Station 5 is at the surface, whereas at Station 1 it is at depth, which suggests that the edge of the front is closer to Station 5 than to Station 1. Station 1 would be land side of the front in more well mixed waters, resulting in phytoplankton being mixed to greater depths. Station 3 seems to be the most representative of the expected conditions close to the edge on the stratified side of the front, with a high abundance of phytoplankton at the surface but even more at depth near the pycnocline.
The high abundance of diatoms at the front can be compared to the dissolved silicon values of the sampled stations. Station 3 has the lowest concentration as would be expected, due to the greater abundance of diatoms compared to the other stations. Station 5 has the highest amount of dissolved silicon, which is slightly anomalous considering that it also has the second highest number of Chaetoceros at a single station.
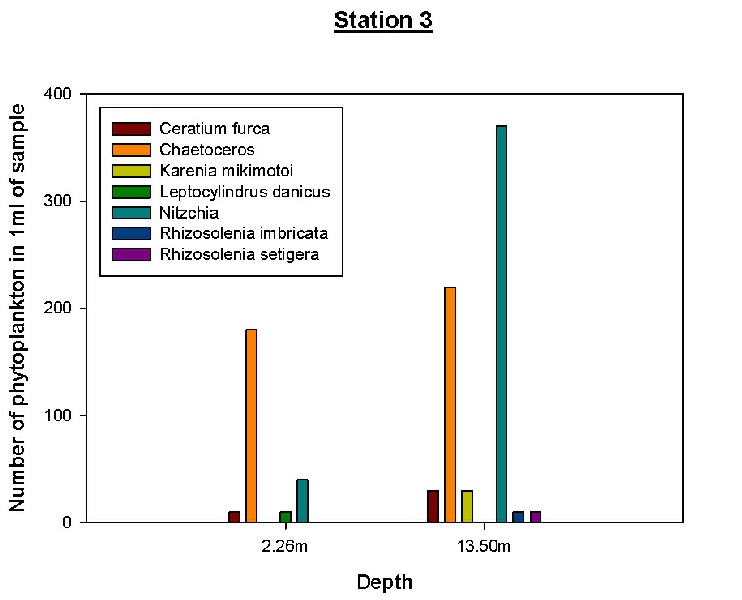
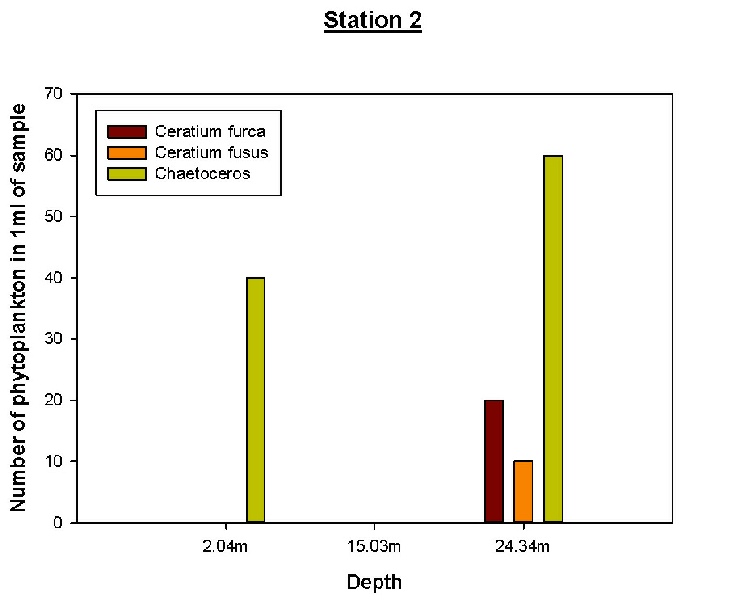
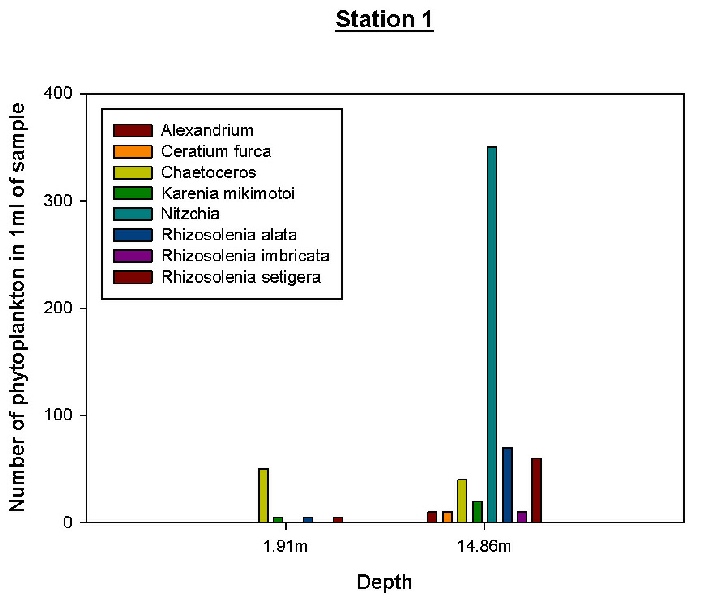
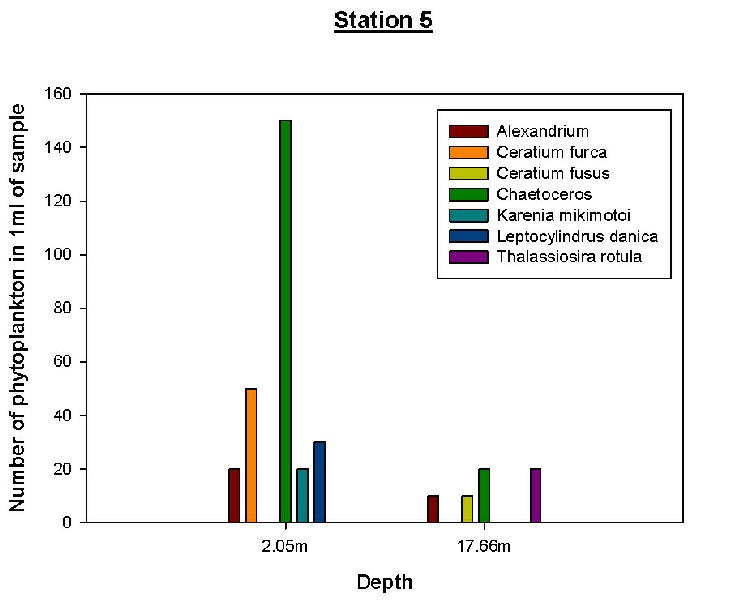
Table 1
Figure 15
Figure 16
Figure 17
Figure 18
Zooplankton
Interpretation
Zooplankton samples were collected at station 1 at 15m depth, station 2 at 10m, 20m
twice and 30m depth, and at station 5 at 10m and 20m depth. An average was taken
for the 2 samples at 20m depth at station 2. The plankton net deployed had a diameter
of 60cm and a mesh of 200 microns and the samples collected were made up to 1 litre
in the lab before 10ml samples from that 1 litre were analysed (Table 1).
Station
1 at 15m had the largest amount of zooplankton species overall with 767 organisms
sampled, followed by station 2 at 10m with 515 organisms (See Figure 1). Since station
1 was closest to the shore and estuary, the high number of zooplankton would be due
to coastal upwelling and less transportation than at sea, allowing the numbers to
build up in the area. The lowest numbers of zooplankton overall were found at 20m
depth at station 5 which was further out, away from any shelter from the bay where
stronger currents would prevent zooplankton numbers to gather and therefore create
a lower concentration. No fish larvae or Siphonophorae were found at any stations.
Looking at the abundance vs. depth and biodiversity depth graphs for zooplankton samples; there are not enough points to provide a clear relationship between the variables. However, we can assume that as depth increases both diversity and abundance of species increases, with the exception of station 2 where the highest diversity of species is at the intermediate depth of around 20m. This correlates with the abundance of phytoplankton at the stations also increasing with depth as they are a food source for the zooplankton. However, this pattern is not seen at station 5 but this could possibly be due to the lack of data points on the graph or inaccurate identification of organisms.
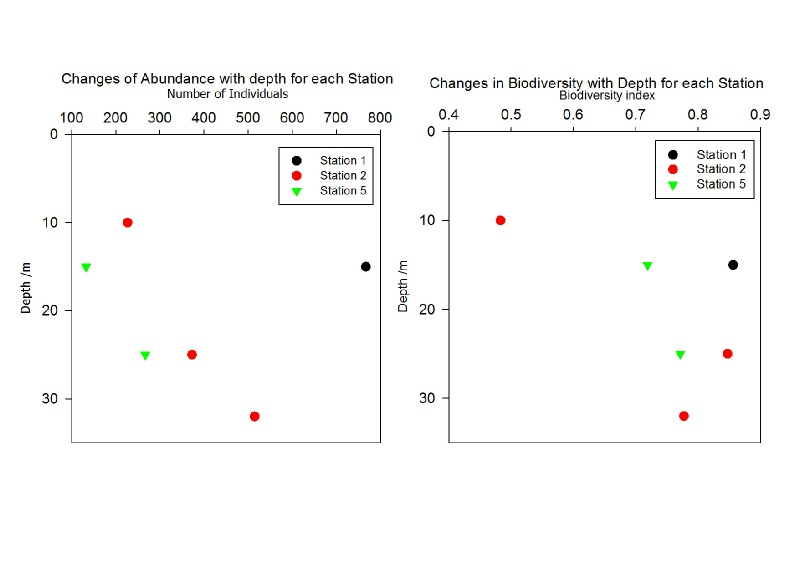
Figure 19
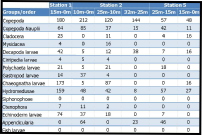
Table 2