
Disclaimer: These findings are the personal interpretation of the students involved and do not reflect the views of the University of Southampton, the National Oceanography Centre or Falmouth Marine School.


A survey to examine the physical and biological parameters of the seasonally stratified waters offshore of the Fal estuary was conducted on 2nd July 2013 aboard RV Callista between 07.57 and 11.06 UTC. The aim of the survey was to study the profile of the water column on either side and within the tidal front found off of the south coast of Cornwall during summer months. The objective was to survey one station closer to shore where it was expected that the water column would be well mixed with little sign of thermal and nutrient stratification, then to move off shore and locate the front using sea surface temperature data from an ADCP to elucidate the position of the front. The next two stations would be sampled within the front and the final station would be the further offshore where a stratified water column and discrete layers of phytoplankton primary production would be expected.
However, on the day of the survey the weather conditions had changed considerably when compared to the previous day. Cloud cover increased and visibility decreased from good (10-19km) on the previous day to moderate (4-9km) and eventually poor (1-3.9km) by 10.00 UTC (Met Office 2013). Likewise wind speed and direction changed from 2.7ms-1 WSW on the previous day to 8.0ms-1 SSW with gusts up to 16.5ms-1 (Met Office 2013). These conditions increased the sea swell and meant that the initial plan of the survey was considered too dangerous to undertake; therefore a re-evaluation of the plan was required.
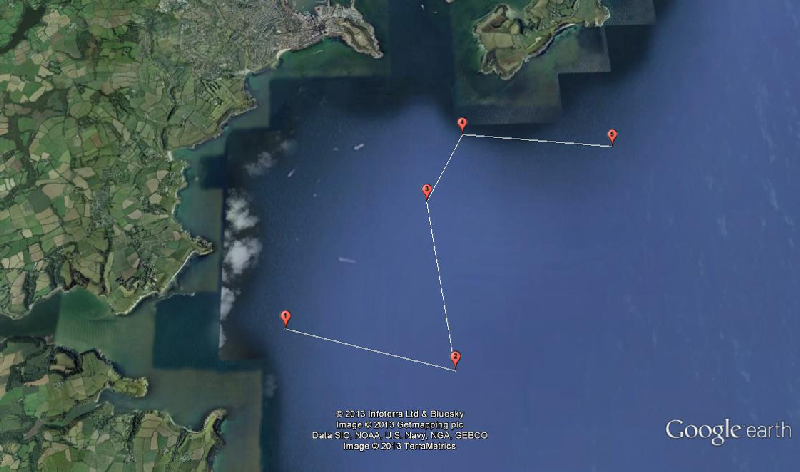
The suggested plan was to remain close to shore within Falmouth Bay and in the lee of the Manacle Point. A total of five stations were visited, with samples taken at 4 of them; the first station was used to determine the position in regards to the tidal front. ADCP data indicated a mixed water column suggesting that the station was shoreward of the front. Station two sampled on the seaward side of the front, stations three and four were blind sample on the coast side of the front and the last station was at Station 1.
Initial surface ADCP profiles were examined to ascertain the nature of the water column and this information was used to indicate the mixing qualities within the water column. This helped to determine whether the deployment of the CTD profiler and zooplankton nets were necessary to collect data that would fulfil the aims.
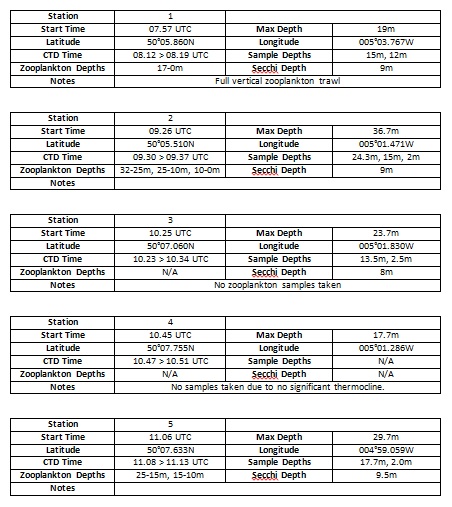
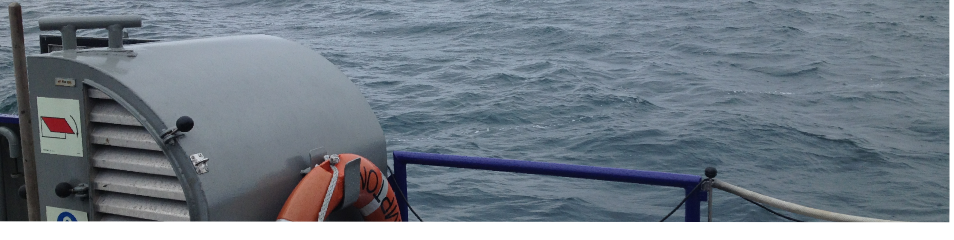
Protocol on this survey was similar to that used on the RV Bill Conway within the Fal estuary. At each station a CTD profiler was deployed to collect physical data (depth, temperature, salinity, fluorometry - chlorophyll concentration, transmissometry - light attenuation and irradiance) with a combined rosette of Niskin bottles to sample at discrete depths for chemical analysis (phosphate, nitrate, silicon, chlorophyll and phytoplankton). At selected stations vertical zooplankton trawls were made using a 200 micrometre, 60cm diameter closing net to sample discrete depths. All information regarding each individual station may be found in table 1.
Table 1
Conclusion
Although the initial objective of the survey was not feasible due to difficult weather conditions, interesting results were achieved. Firstly, results collected on this survey indicate the nature of the water column after a short-term change in weather conditions and the unstable nature of tidal fronts (Mason et al. 2005). This can be used as a valuable comparison to stratified water column data collected by previous groups which in turn may indicate the breakdown of thermal and nutrient stratification and entrainment of nutrients upwards through the water column after a short episodic wind events (Sharples 2007).
Secondly, it was originally thought that the blind sampling nature of the survey would provide inconclusive data as to the position of the tidal front. The main limitation was that real-time sea surface temperature (SST) data was being used to indicate front boundary; however due to surface mixing the SST remained homogeneous throughout the transect suggesting that there was no tidal front. This was further confounded by CTD profiles that indicated a mixed water column. Real-time ADCP data had been unable to locate the front during the survey; however, with further lab analysis it was possible to identify the front between 10-15m during the transect between station 1 and station 2. This suggests that the transect travelled across the front, this is further confirmed by the calculation of a high Richardson Number (Ri) at station 2 demonstrating increased shear flow between water bodies which is an indication of stratification. Further Ri calculated for stations 1 and 3 show minor stratification suggesting that these stations are close to the front; however, with the exception of station 5, all other stations are shoreward of the front as shown by a low Ri number and a low level of stratification.
Temperature data can be linked to tidal front data, with station 2 displaying a high level of thermal stratification when compared to the other stations. Further analysis of previous survey group data also suggests that even though atmospheric weather conditions on the day of the survey were cooler that of previous surveys, the SST was higher that than of surveys conducted in the previous week. This suggests that atmospheric heating has warmed surface waters and created increased thermal stratification.
The tidal front also indicates an area of higher biological productivity when compared to surrounding waters and play a key role in the aggregation of primary and secondary producer and higher trophic levels (Mason et al. 2005). Likewise, fronts may act as a vertical nutrient barrier limiting coastal nutrient export to the continental shelf seas (Mason et al. 2005). Overall nutrient depth profiles suggest nutrient levels increase with depth, as would be expected by thermal stratification; however, several anomalies can confound results, stations indicated a decrease in concentration with depth and one nitrate sample station had a significantly higher concentration value greater than an order of magnitude larger than other samples suggesting lab analysis error. It is important to note that the majority of the stations sampled were shoreward of the front where a homogeneous, well mixed water would be expected; however, major nutrients still increase may be indicative of increased primary production at the surface which declines with depth. Therefore, it may be useful to look at subsequent survey data which may indicate the further breakdown of stratification and an even more uniform nutrient depth profile.
Chlorophyll concentration (which is used as a proxy for phytoplankton concentration) as a rule increases between 0-15m, in line with the depth of the tidal front, below 15m chlorophyll concentration decreases suggesting that the tidal front acts as a thermal barrier to primary production below which primary production is limited. Dissolved oxygen (DO) is highest in the surface waters and declines with depth as is usually found in eutrophic seas where photosynthetic processes dominate at the surface and a decline in DO suggests a decline in the rate of photosynthesis.
Samples of phytoplankton suggest that diatom species Chaetoceros and Nitzchia were the dominant species with dinoflagellates (Ceratium furca) being the next most abundant. This is in line with Margalef’s mandala which suggest that diatoms are predominant when the water column is more turbulent and nutrient levels are high (Smayda & Reynolds, 2001); whereas, dinoflagellates favour a stratified water column where nutrients are more limited. Therefore, in the Western English Chanel diatoms are more dominant in spring and early summer before dieing back and being replaced by successional dinoflagellate groups. This may also be indicated by the depletion of silicon in the water column which is taken up by diatoms to build siliceous frustules. Over the 11 days of this field trip silicon levels have been reasonably uniform, further analysis over subsequent weeks may show a depletion of silicon and it would be expected that this would correspond to a decline in diatoms and an increase in dinoflagellates.
During the 11 day survey, physical, chemical and biological processes have been studied in the estuary and coastal seas of the South coast of Cornwall. It is clear that this region is controlled by many complex processes and that continuous monitoring is key in understanding those processes. This information is the most important tool used to inform policy with regards to conservation and industrial infrastructure in areas where both unique biological habitat, valuable fishing grounds, important maritime and recreational industries are so closely related in both resources and proximity.
Interpretation of Richardson numbers calculated for each station, along with comparisons between samples taken at the same location 10 days apart.
Including chemical data and interpretations for highlighted nutrients such as Phosphate, Nitrate and Silicon for the five stations. Interpretations for Dissolved Oxygen and Chlorophyll are also included.
Data on the abundance of phytoplankton and zooplankton collected offshore, including species genus and group data, and how this relates to the dissolved nutrient concentration.