
Physical Analysis
Temperature
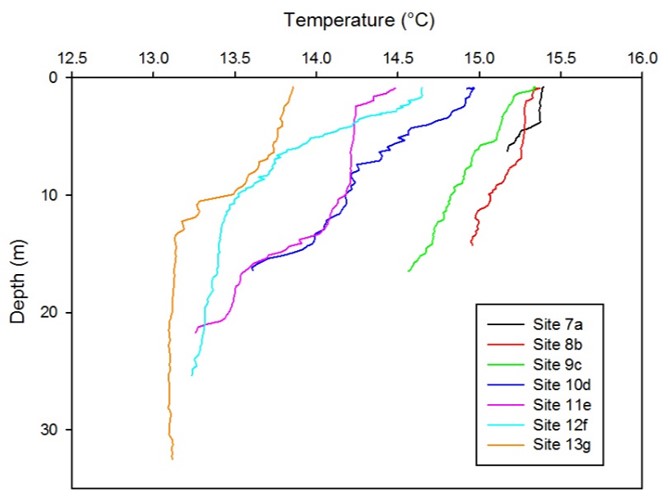
The temperature against depth profiles along the Fal Estuary indicate that in general, the surface temperature is relatively warmer than temperature at depth (Fig. 1). The upstream temperature is warmer compared to downstream, but the temperature range is smaller upstream relative to downstream. For example, at site 7A, the temperature range is 15.4oC at the surface and 15.2oC at the bottom whilst site 13G recorded surface temperature at 13.9oC and 13.1oC bottom temperature.
The observed downstream profiles show evidence for a summer thermocline. At deep water, heat is dissipated within water column, hence there must be strong heat to fully raise the temperature of the deeper water. At site 13G for example, below 10m the temperature is homogenous at 13.1oC though above 10m the water temperature is warm due to rapid heating during summer. Meanwhile, for shallow, upstream sites, solar heating is relatively easier to raise the water temperature in addition to rapid mixing. It is interesting to observe that for sites 13G and 11E the temperature against depth profiles show that the temperature decreases relatively rapidly, compared to the slowly decreasing temperature of sites site 12F and 10D which is possibly due to better mixing.
Salinity
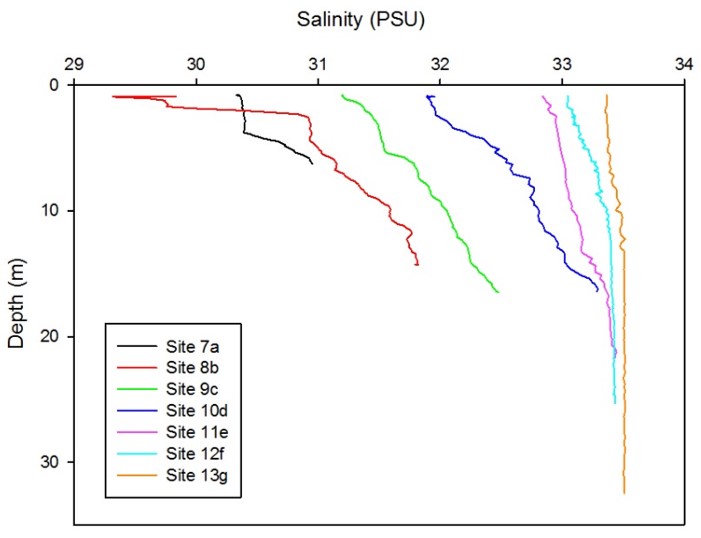
The salinity against depth profiles along the Fal estuary indicate that there is a significant salinity range between the surface samples upstream (site 7A) and at the river mouth (site 13G), i.e. 29.5psu and 33.5psu respectively (Fig. 2). In general, salinity is low on the surface and increases with depth. At 5m depth, there is strong stratification for the upstream sites, as shown by the sharp changes in gradient such as at site 8B (change of salinity from 29.5psu to 31psu) and site 9C (change from 31.2psu to 31.5psu) and becoming more homogenous at deeper end of the river mouth (sites 11E, 12F, 13G).
Stratification can be explained by the receding water during ebbing, in which friction with the sea bed causes freshwater layer on the top to be pulled downstream, ‘overriding’ the dense, seawater layer at the bottom. Also, the river mouth is more exposed to stronger influence of winds, storms and a bigger volume of seawater to promote physical mixing. The salinity profiles for site 8B has the biggest salinity range between surface and bottom (29.5psu and 31.6psu, respectively). This may be due to the fact that it is situated on the confluence of River Truro and River Fal. These two rivers carry fresh water while overriding the high saline sea water at the bottom.
Transmission
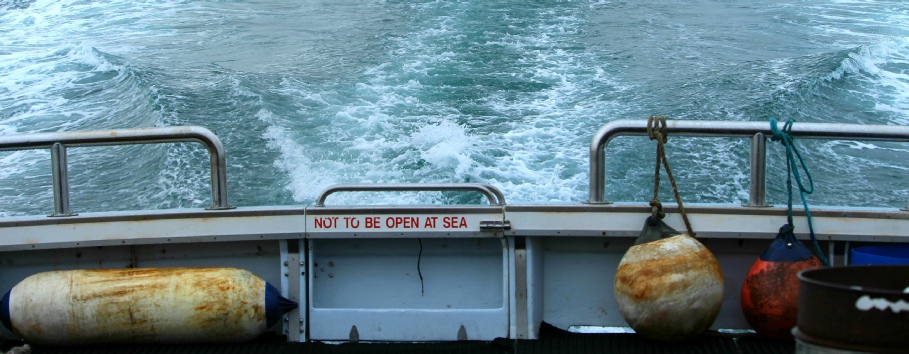
Upstream sites 7A and 8B were observed to have similar profiles, at low range 3.65 to 3.79V. This indicate high turbidity of the water column due to greater input of particulate materials from source. Whereas near the river mouth, sites 12F and 13G have a high range from 4.45 to 4.56V due to the particulate matter settling onto the seabed. Turbidity is the opposite of transmission voltage, hence upstream sites have turbidity profiles which are higher, and becoming lower and more homogenous towards the river mouth. Site 13G transmission is near uniform with depth, whereas site 11E had a drop in turbidity near the surface. This is due to a boat passing, causing a surface disturbance.
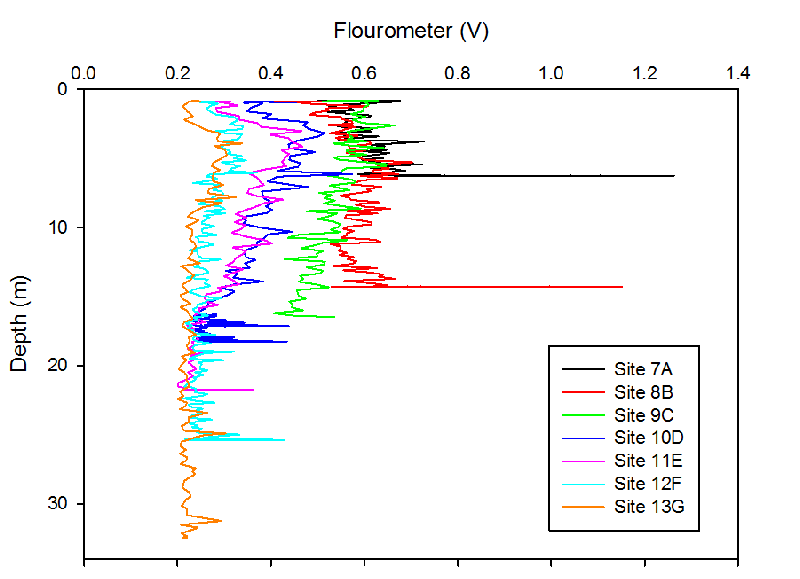
Flourometry
Fig. 1 Temperature profile with depth at each sampling location along the Fal Estuary
Fig. 2 Salinity profile with depth at each sampling location along the Fal Estuary
Fig. 3 Transmission profile with depth of at each sampling location along the Fal Estuary
Fig. 4 Transmission profile with depth of at each sampling location along the Fal Estuary
Flourometer corresponds to the chlorophyll level in the water column, in which the
upstream sites were observed to have high concentration (range 0.5-
ADCP Profiles
7A
8B
9C
10D
11E
12F
13G
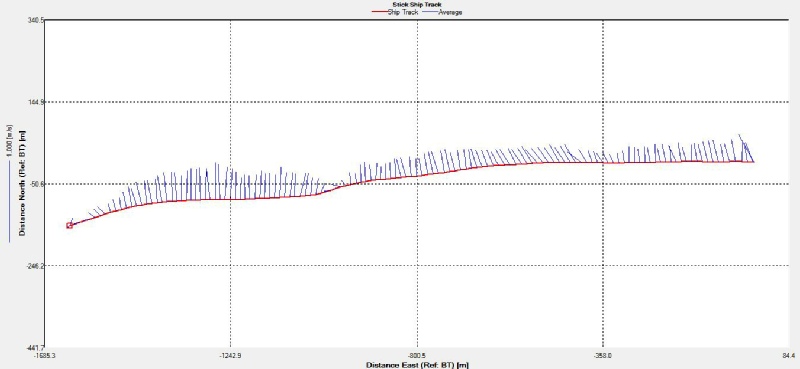
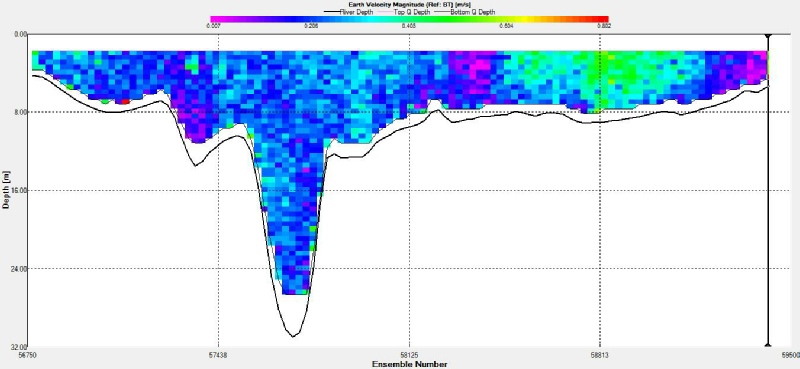
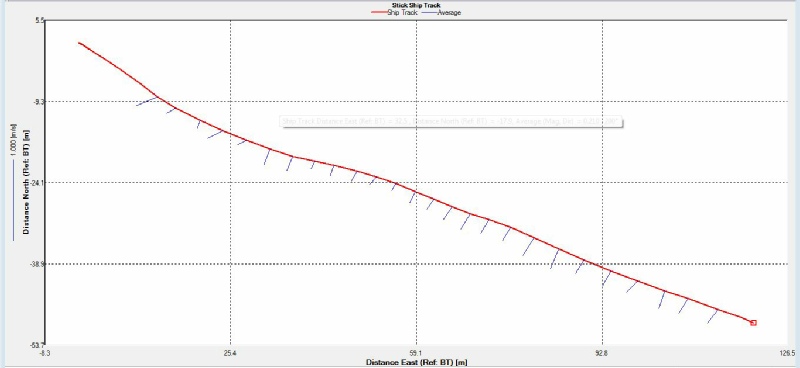
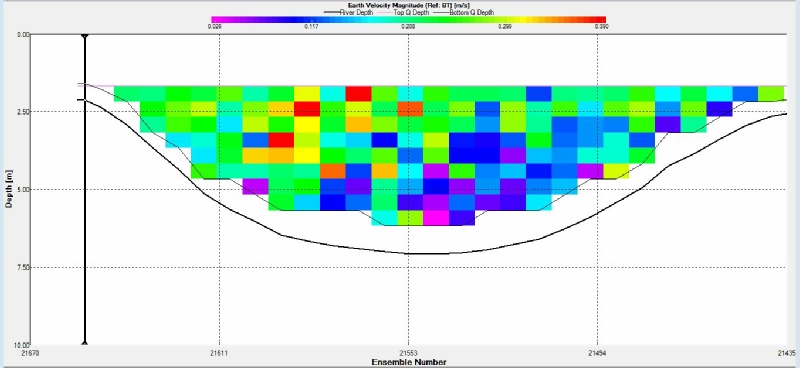
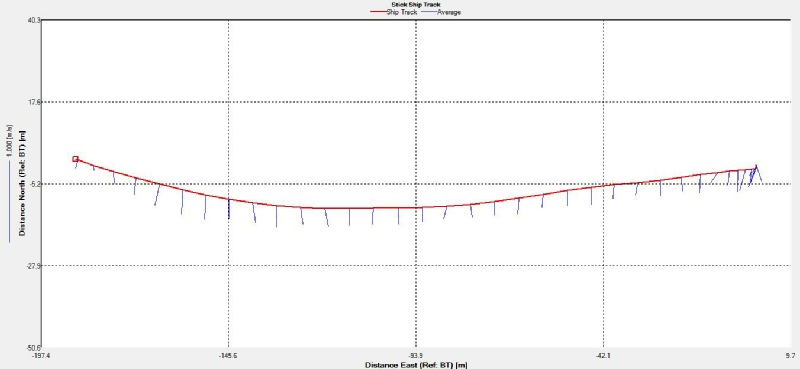
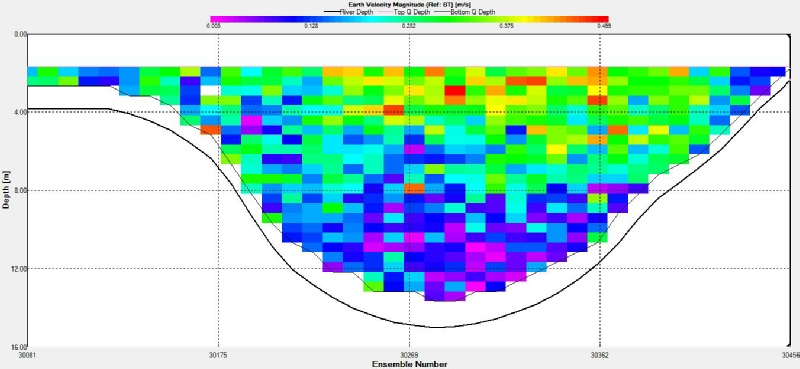
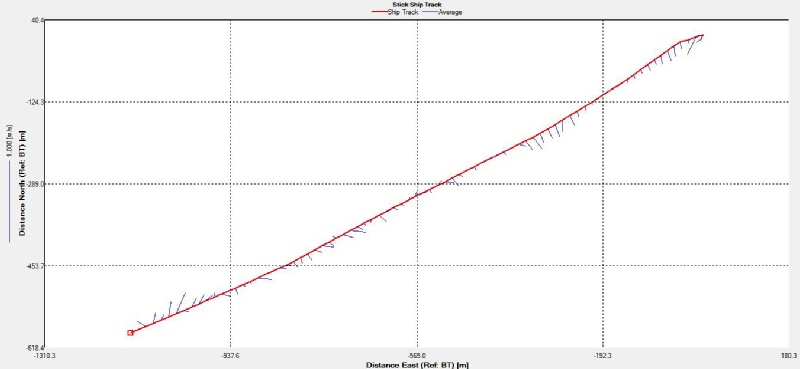
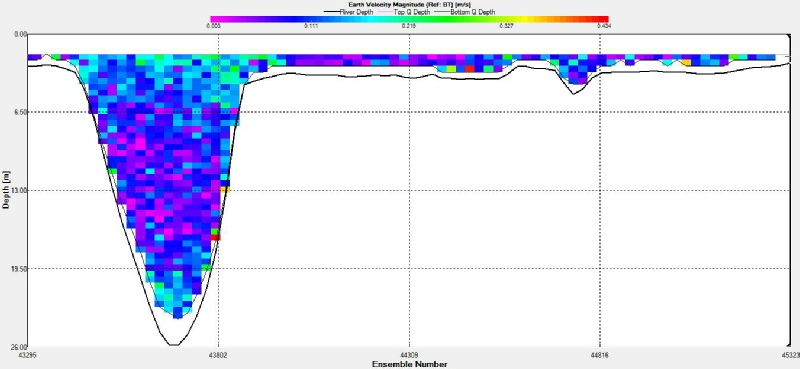
Site 7A was located close to the convergence of two smaller rivers, the ADCP plot shows the flow velocity was highest towards the eastern side of the bank, this could be because the discharge from the eastern tributary was greatest. The stick plot shows fairly strong southward unidirectional flow; this is as expected because the transect taken across the river at site A was taken soon after high tide showing the ebb phase of the tide.
Site 8B was located just after the convergence of the Falmouth from the east, hence why the flow velocity is seen to be greatest towards the eastern side of the bank. The stick plot here is still showing strong southward flow, as the tide is still in the ebb phase of the cycle.
The transect taken close to station 9C is very similar to the transect taken 30 minutes earlier at 8B.
Site 10D was located where the smaller rivers and tributaries open out into the main body of the estuary (Carrick roads), the flow velocity here is greater at the surface and fairly uniform across the estuary from bank to bank. The stick plot along this transect is still showing southward unidirectional flow, but the length of the sticks are much shorter showing the strength of the flow has decreased considerably as the tide heads towards slack low water.
At station 11E the stick plot shows multidirectional flow as the tidal phase approaches low tide; the sticks are also shorter in length as the tide slackens. The velocity is greater at the surface in the main channel but overall is quite low as we approach low tide and the flow slackens.
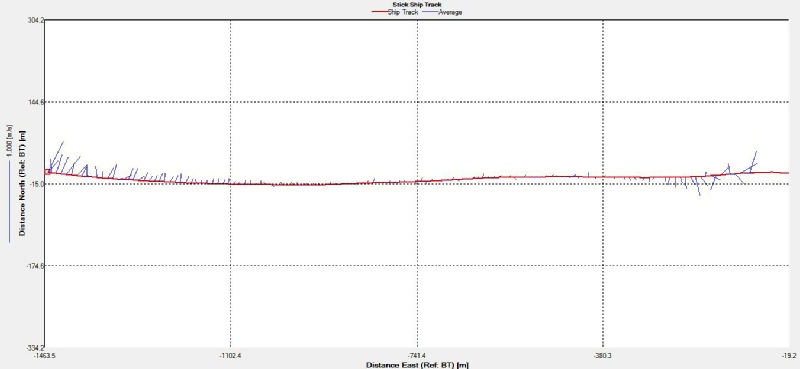
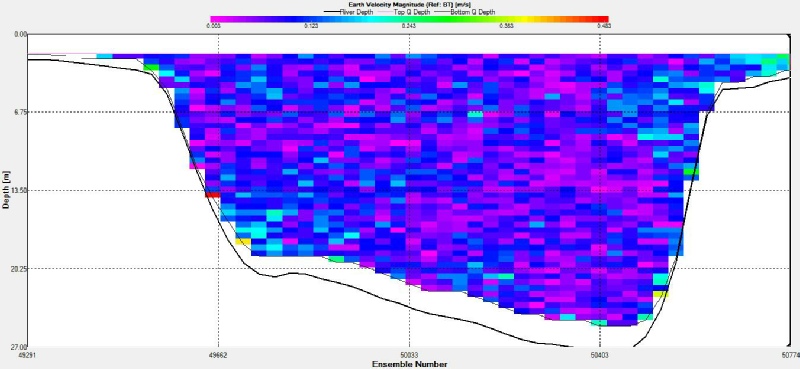
Station 12F was located close to the mouth of Carrick roads and the ADCP transect was collected 3 minutes before the predicted low tide which is why low velocity is seen throughout the depth of the estuary. The stick plot also doesn’t show any net northward or southward flow, confirming low tide. There is southward flow towards the eastern side of the bank and northern flow towards the western bank, which suggests the tide, is turning.
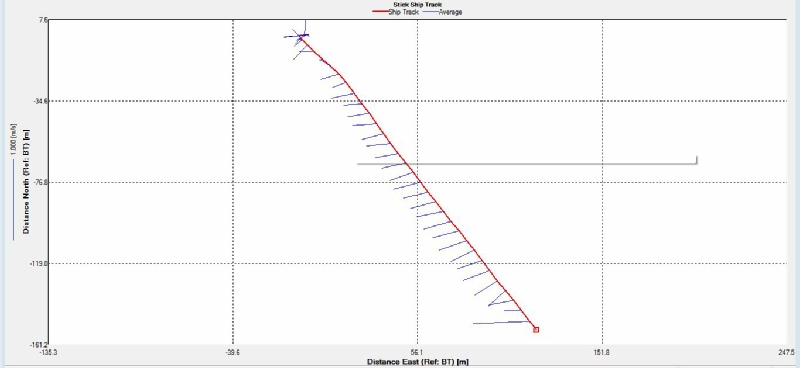
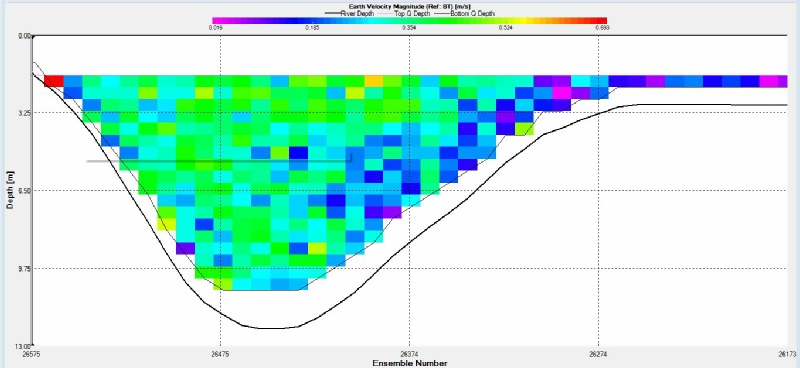
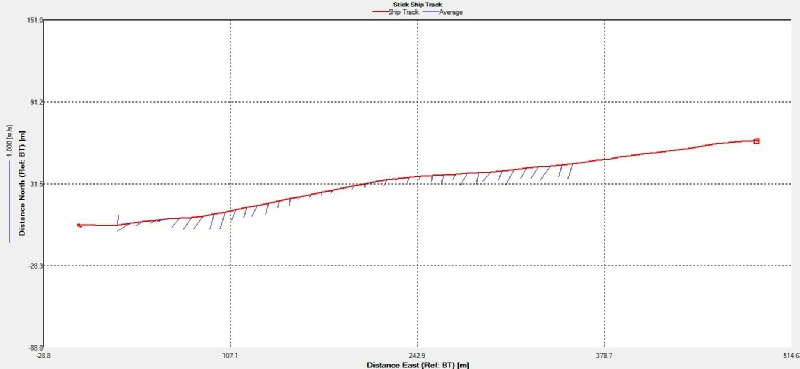
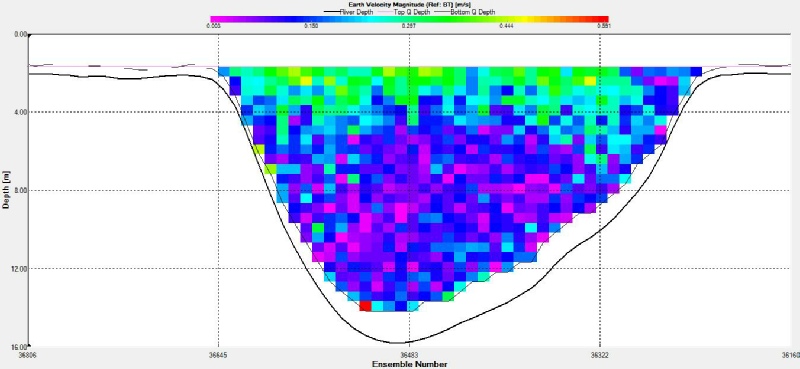
This transect was taken across the mouth of the estuary at Penndenis point an hour after low tide. Both the stick plot and the depth profile show increased velocities, this is as expected as the tide has just turned and is now flooding and approaching high tide for the second time.
Richardson Number
The Richardson number (Ri) derived will give a hint as to whether there will be mechanical mixing or stratification, with critical values Ri < 0.25 and Ri > 1 respectively, and between the two there is a transition state. Ri is essentially the ratio of stratification to the square of shear in horizontal current as represented by this formula:
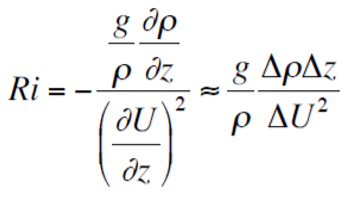
where: g is 9.81 ms‐2; ρ is the mean density (1025 kg m‐3); Δz is difference in depth
(m); ΔU is the change in velocity (ms-
Key findings:
- All the sites are found to be well mixed (Ri < 0.25) however at site 13G at the top layer there is a transition state (Ri number 0.71), indicating a change from mixed to stratified. This site is at the river mouth, at a front with seawater.
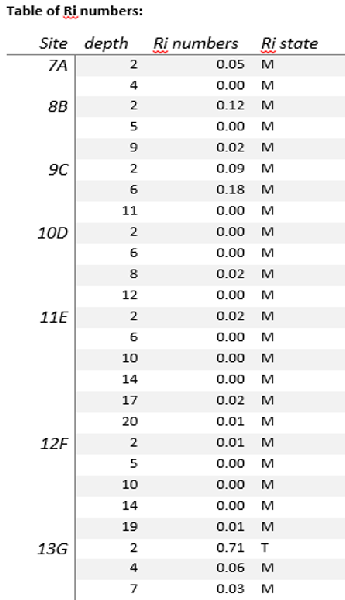
Fig. 5 Richardson number for the seven sampling sites along the Fal Estuary. S=stratified
Ri > 1 , M=mixed Ri < 0.25, T=transition 1 > Ri > 0.25. Note: Each depth corresponds
to 1m differences in density and velocity, for example, 2m depth means calculations
made between 2-
| Chemical Analysis |
| Biological Analysis |
| Physical Analysis |
| Chemical Analysis |
| Biological Analysis |
| Physical Analysis |