
Chemical analysis
Silicon
Nitrate
Phosphate
Oxygen Concentration
Chlorophyll
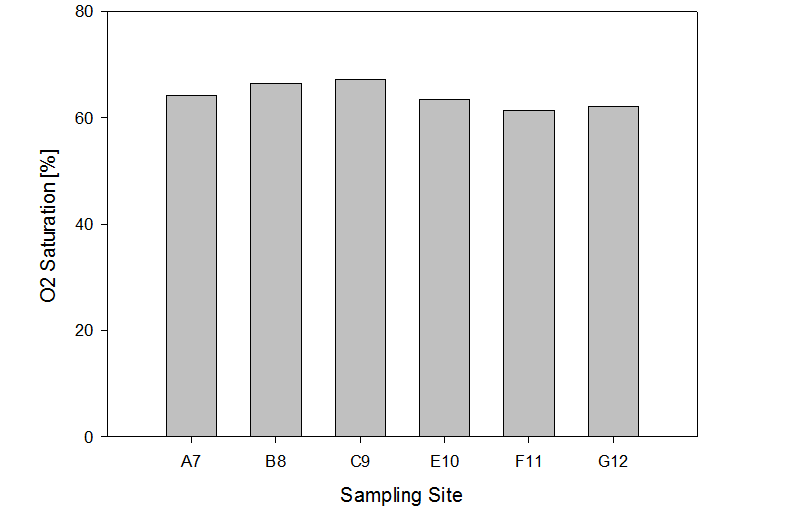
Across all six of the sampling sites, there was little noticeable difference in the
% Oxygen Saturation at two meters depth (Fig. 4). All of the values sit between 60-
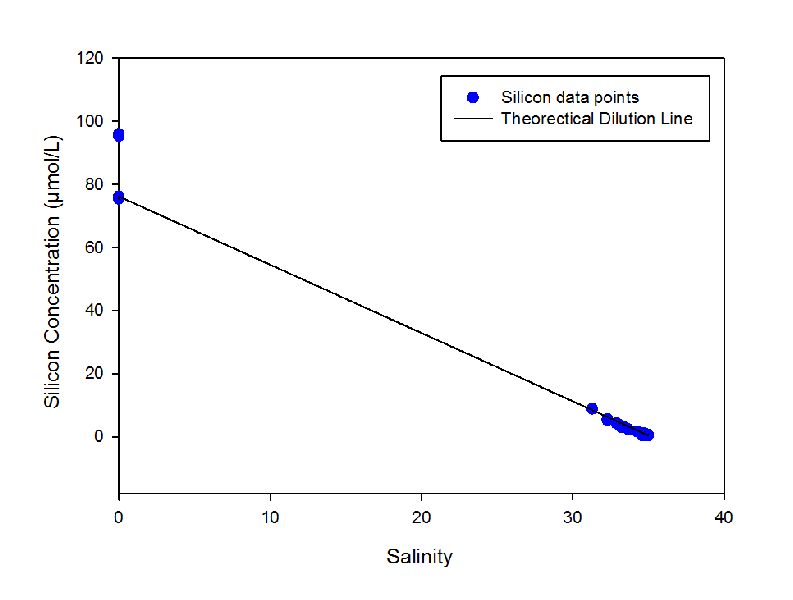
Silicon was found to follow conservative behaviour along the Fal Estuary (Fig. 1).
The plotted point follows the theoretical dilution very well meaning conservative.
The main source of silicon to estuaries is from erosion of silicate rocks and transport
by rivers. The fact it is conservative means that silicon is not being removed from
the estuary by any processes other than dilution due to mixing. Silicate could behave
non-
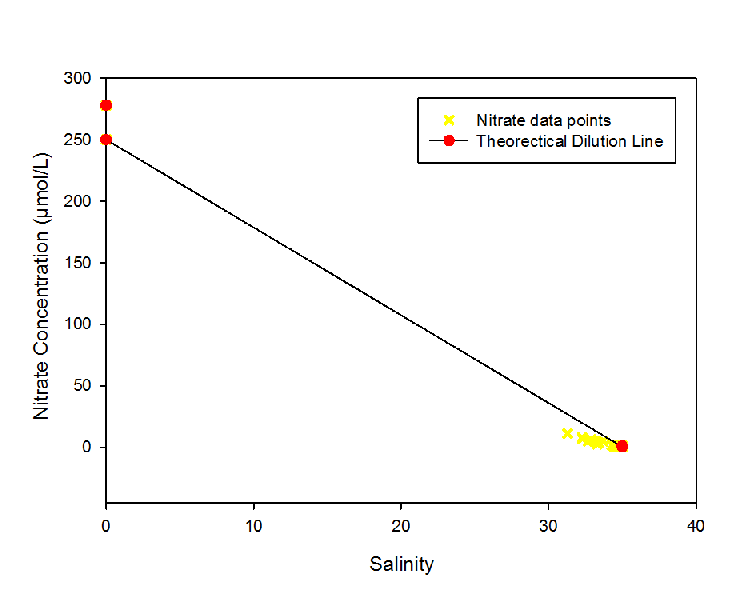
Nitrate was found to follow non-
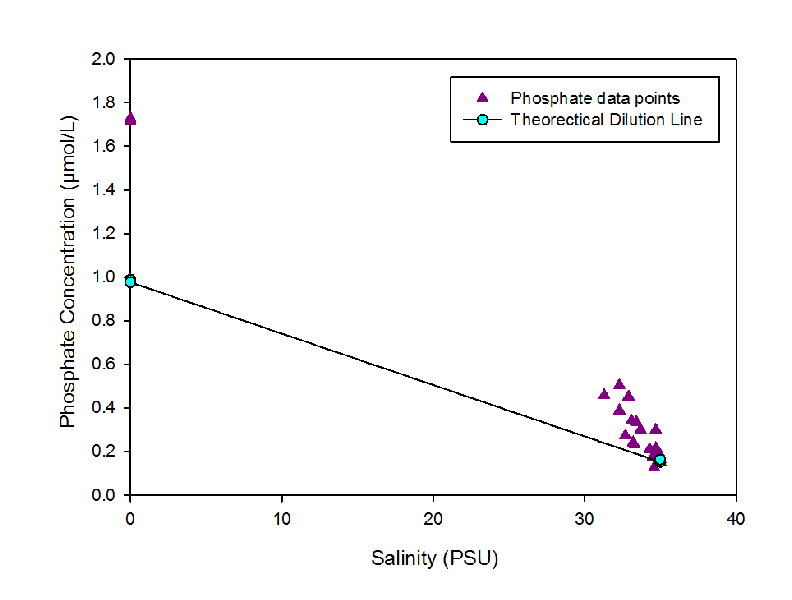
A steep decrease in phosphate concentration from 0.5 µmol/l to 0.2µmol/l was observed
between salinity of 32 to 35 (Fig. 3). Phosphate followed non-
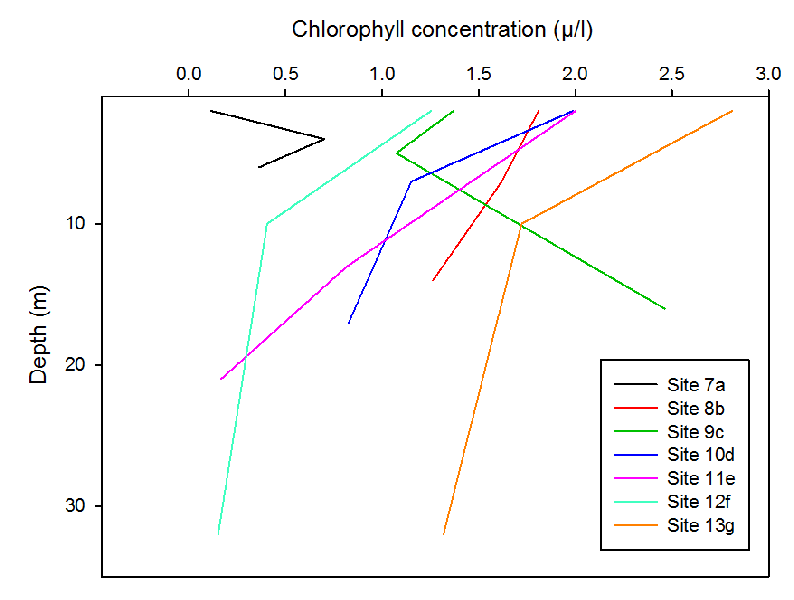
Fig. 1 Silicon estuarine mixing diagram with associated theoretical dilution line connecting the river and marine endmembers within the Fal Estuary
Fig. 2 Nitrate estuarine mixing diagram with associated theoretical dilution line connecting the river and marine endmembers within the Fal Estuary
Fig. 3 Phosphate estuarine mixing diagram with associated theoretical dilution line connecting the river and marine endmembers within the Fal Estuary
Fig. 4 Surface oxygen saturation along six sample stations within the Fal Estuary
Fig. 5 Chlorophyll concentration with depth along seven sample stations within the Fal Estuary
The overall trend in the chlorophyll data shows an increase in chlorophyll concentration
with depth (Fig. 5). This pattern is seen in 5 of the seven sites that were sampled
(8b, 10d, 11e, 12f & 13g). At site 7a, there was a value of approximately 0.2μg l-
The overall trend suggest that there is a greater amount of phytoplankton in surface waters.