
Physical Analysis
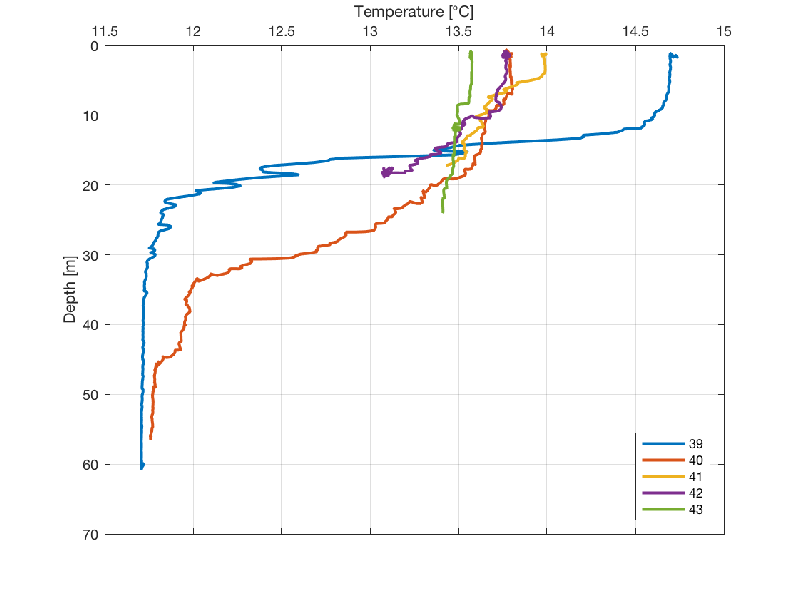
Temperature
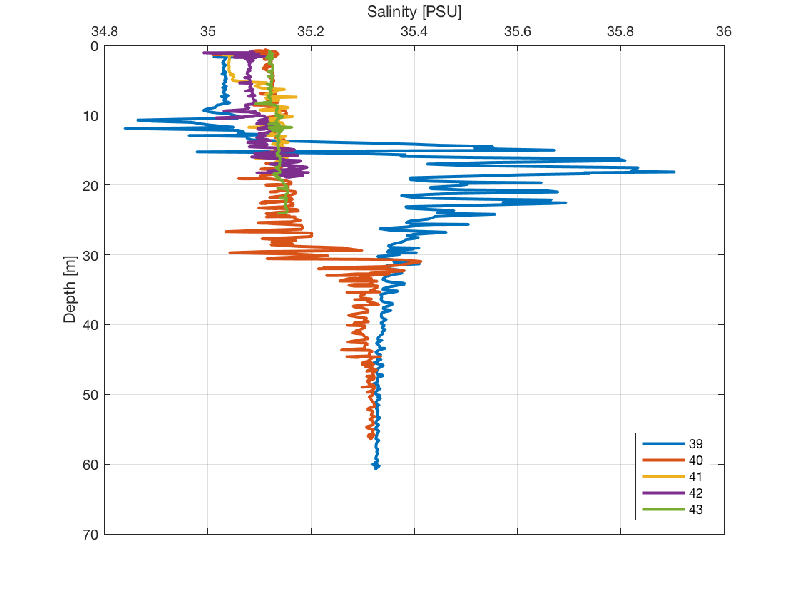
Salinity
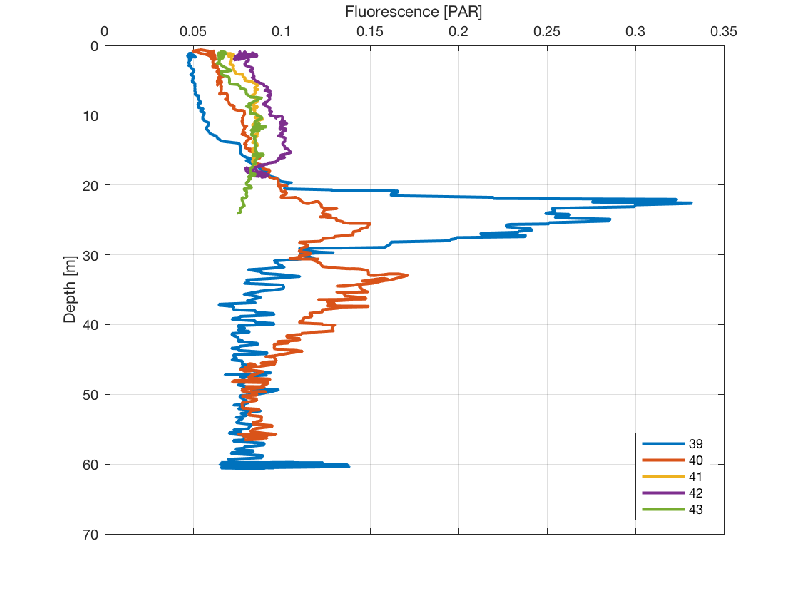
Fluorescence
Richardson Number
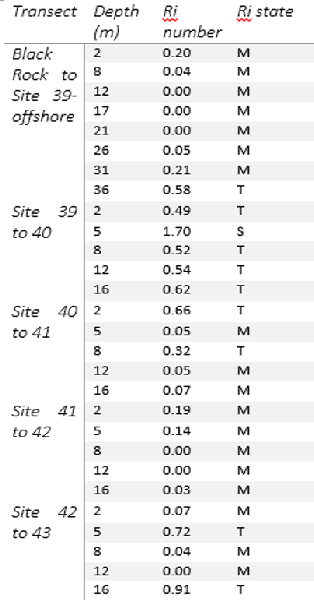
Richardson number tend to decrease from inshore to offshore. This means there is strong mixing at the river mouth compared to offshore, as shown by the Ri numbers calculated from transect Black Rock to site 39 (offshore). The mixing also becomes less pronounced at depth (36m, Ri number 0.58) compared to shallow depth (12m, Ri number 0). As depth increases from shallow to deep stratification increases due to less drag and influence of sea bed to encourage mixing.
Transect site 39 to 40 is profiling across an offshore front, whereby the Ri number
on the top layer is low (0.49) indicating weak mixing, but became stratified again
at 5-
Moving inshore, transect site 40 to 41 is going back to the shallow river mouth, in which there is more mixing at depth relative to the top layer and more stratified at surface. This is due to the fact that there is river flow into the offshore basin, and the top layer of the water column is the front of river water and seawater.
Transect from site 41 to 42 is calculated to have a low Ri number, an evidence for a very well mixed profile, as the transect is recorded along the shore (coastline) of the river mouth. Here, there is rapid mixing especially when in near proximity to headland. Seabed allows for friction, drag and mixing.
Transect from site 42 to 43 is across the Fal estuary mouth (West to North-
Site 39 shows a homogenous mixed surface layer to a depth of around 11 meters, with a temperature of around 14.8°C. This then drops rapidly to 11.7 °C at a depth of around 20 meters. This indicates a strong thermocline with a difference of 3.1°C, the temperature then remains at 11.9°C in the well mixed layer. Site 40 follows a similar pattern to Site 39. There is, however, a less prominent thermocline and lower surface temperature. Temperature at depth is also similar to Site 39 with a value of 11.7°C. Site 41,42 and 43 show very little temperature differentiation, with less than 1°C from the surface to depth.
Site 39 was located furthest offshore and consequently displays significant stratification as it experiences the smallest tidal influence. The remaining stations were located further inshore and therefore increased mixing is likely to be responsible for the reduced temperature gradient.
Fluorescence can be used as an indication of chlorophyll, and subsequently the presence
of phytoplankton in the water column. Station 39 shows a large peak of 0.34 V in
fluorescence between 20 – 30 meters, this is indicative of a large phytoplankton
bloom. This depth also lies just below the thermocline for that station, as well
as a small salinity increase. This potential bloom may have occurred due to nutrients
being concentrated at the thermocline. The peak then decreases rapidly back to 0.07
and remains relatively constant, this may be due to low irradiance not being able
to support net photosynthesis. Station 40 also shows a peak in fluorescence at 25
and 30 m of around 0.17 V. Stations 41-
There is small salinity deviation at all stations, except station 39 having the largest
range of 1.3 PSU. This may be due to fresh water flux from the Fal estuary as well
as heavy precipitation. Station 39 experienced a peak in salinity of 35.9 PSU, this
occurs just below the thermocline and may therefore be due to the inhibition of mixing
of less saline surface waters with more saline deeper waters, resulting in a small
peak in salinity. Station 40 shows a much smaller salinity range of 0.3 PSU, again
a slight freshening at the surface is visible. Stations 41-
Fig.1 Temperature against depth for 5 offshore sampling sites in the Fal and Helford Bay
Fig.2 Salinity against depth for 5 offshore sampling sites in the Fal and Helford Bay
Fig.3 Fluorescence against depth for 5 offshore sampling sites in the Fal and Helford Bay
Fig. 4 Richardson number for the five sampling sites along the Fal and Helford Bay.
S=stratified Ri > 1 , M=mixed Ri < 0.25, T=transition 1 > Ri > 0.25. Note: Each
depth corresponds to 1m differences in density and velocity, for example, 2m depth
means calculations made between 2-