
Biological
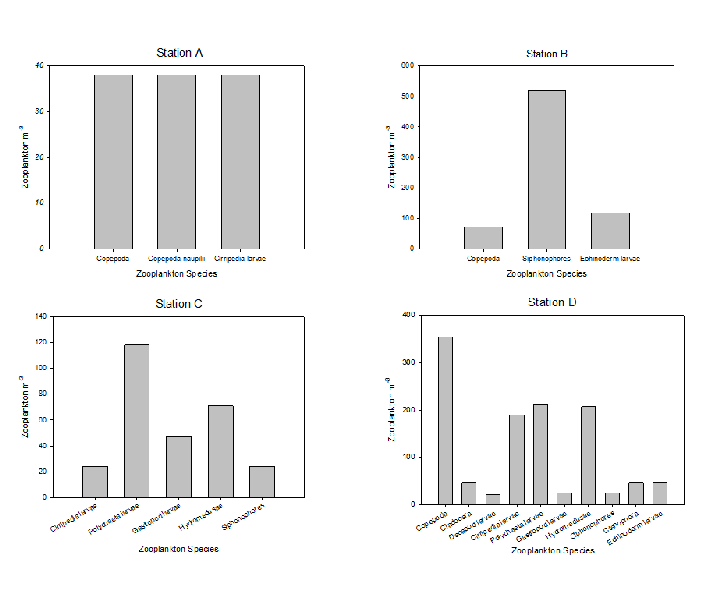
Zooplankton
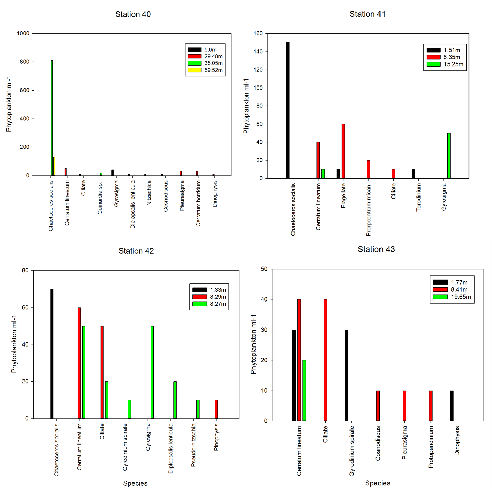
Phytoplankton
The data for Stations A & B were both collected at Site 39, the furthest point offshore
that was sampled. Station A was collected from 30-
The general pattern seen in this data is that diversity of zooplankton decreases
from 0-
The overall number of phytoplankton decreases as we move from the offshore stations to the estuarine stations however diversity increases (Fig. 2). For Station 40, in the deep water at 35m there were very high numbers of one species, however 29.5m seemed to have the greatest diversity. For Station 41 there was high abundance of Chaetoceros socialis at 1.3m, but more diversity in the middle depth at about 8.3m and finally fairly high abundance of Gyrosigma at the deepest around 15.2m. At Station 42 there was a high number of Chaetoceros socialis again at around 1.5m, then higher diversity of species in the middle depths of around 8.3m. For Station 43 there was greater diversity at the 1.7m than at the other stations, 8.41m had the largest diversity of phytoplankton types and finally at 19m, there was lower diversity. Overall phytoplankton diversity with depth seemed low in surface waters, high just below surface and low again at depth with often a high abundance of one species being found in very shallow and deep water.
This pattern could be because there is often nutrient remineralisation occurring at the depths below surface water and therefore more phytoplankton will be found here in order to gain both nutrients and light (Uitz et al, 2006). Fewer species will be found in shallow water because surface waters are often low in nutrients, and they will be low in deep due to not enough light penetrating. However the numbers here are likely to be high of one individual species as they may be specialised and adapted to deal with this environment. Some of the species found such as dinoflagellates may be able to migrate between depths (Olli, 1999).
Reference
K.Olli (1999) Diel vertical migration of phytoplankton and heterotrophic flagellates
in the Gulf of Riga. Journal of Marine Systems, 23:145-
J.Uitz, H.Claustre, A.Morel and S.Hooker (2006) Vertical distribution of phytoplankton communities in open ocean: An assessment based on surface chlorophyll. Journal of geographical research, 111:
Fig. 1 Zooplankton abundance for four samples across three sampling sites in the
Fal and Helford Estuary. Stations A & B were both taken at Site 39 but at different
depths (30-
Fig. 2 Phytoplankton abundance at stations 40, 41, 42 and 43 within the Fal and Helford Bay