
Chemical Analysis
Phosphate
Nitrate
Silicate
Oxygen
Chlorophyll
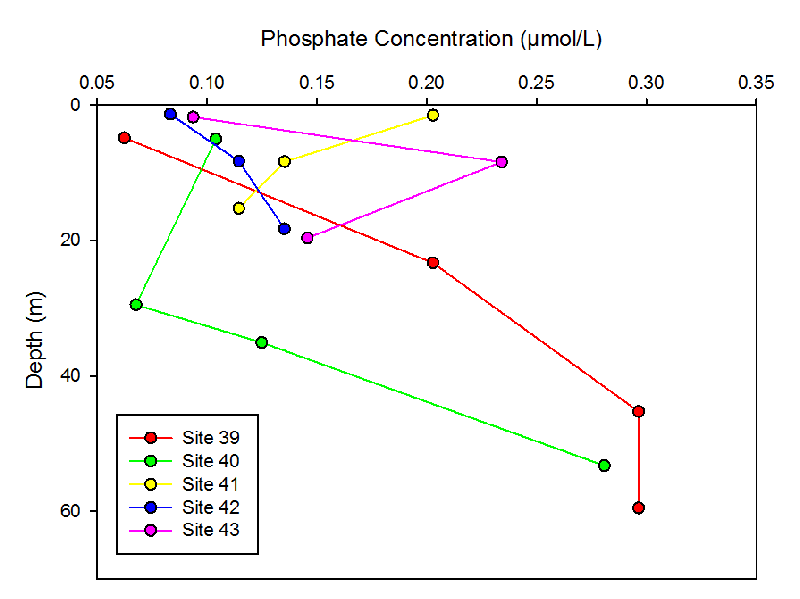
The overall trend is that phosphate concentration initially decreases and then slowly increases with depth (Fig. 1). The initial decrease in concentration seen at the majority of sites is due to uptake by phytoplankton. Phosphate is used in phospholipid bilayers and in ATP as well as other biological processes. The increase which happens at depth, can be clearly seen at site 39 and 40 is due to remineralisation of phosphate at depth. Sites 39 and 40 were the furthest offshore and were the only 2 sites deep enough for this remineralisation to be observed.
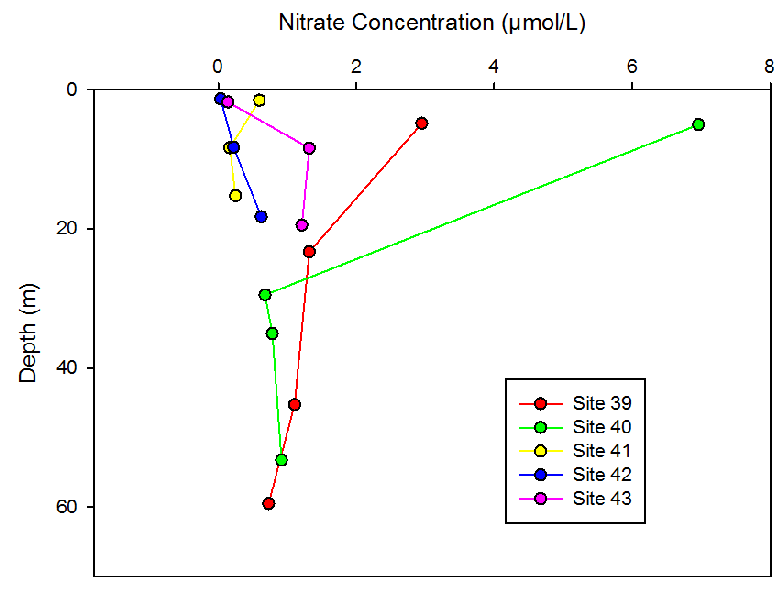
Nitrate concentration showed no obvious trend between the five sites (Fig. 2). Sites 39 and 40, the two furthest offshore, show an initial decrease in concentration in the first 25m due to utilisation by phytoplankton in surface waters. Phytoplankton require nitrate for growth. Sites 41 and 42, which are more inshore, show almost no nitrate in the surface waters. These two sites were sampled near the mouth of the estuary where there is a high amount of primary production providing a possible explanation for the lack of nitrate.
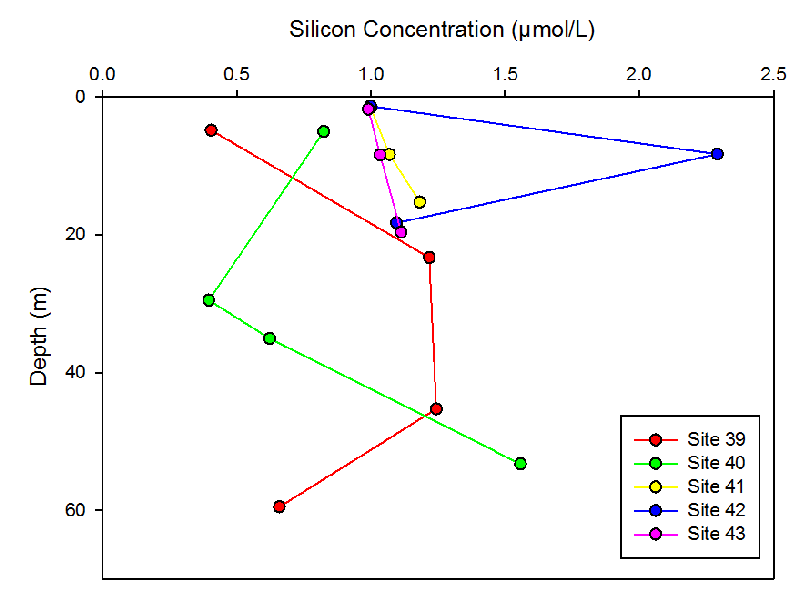
As with nitrate there is no apparent trend in silicon concentration between the sites (Fig. 3). Site 40 is the only site which shows a decrease in concentration in surface waters. This could be due to a possible diatom bloom which incorporate silicon into their frustules. Higher silicon concentrations are observed at sites 41, 42 and 43 which are closer to the estuary. All silicon input into the oceans is due to erosion of silicate rocks and transport by rivers.
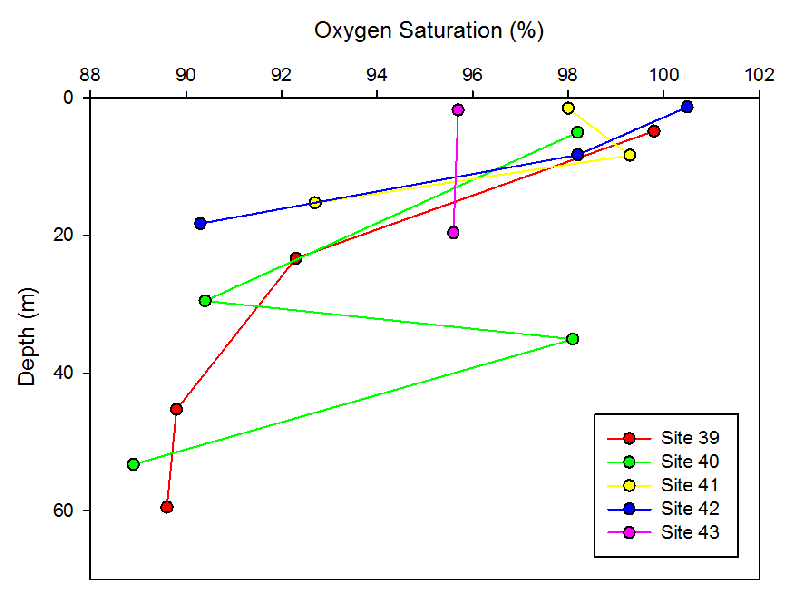
The overall trend for all sites is a decrease in dissolved oxygen saturation with depth (Fig. 4). Site 42 was the only site to show supersaturation at the surface while sites 39, 40 and 41, surface saturations were all high with levels over 98%. These high levels are as expected because at the surface there is a high degree of mixing with the air (bubble formation) which is high in oxygen. As depth through the water column increased, the total respiration in the water column (articulated respiration) increases, resulting in the observed decreases in oxygen saturation with depth. The small increase in oxygen at site 41 in the surface waters could be down to a large amount of primary production in the surface waters at that location. Site 43 has the lowest surface saturation levels of the 5 sites. This could be because it is the site closest to the estuary, and therefore there is less wave action and less mixing with the air resulting in lower saturation levels.
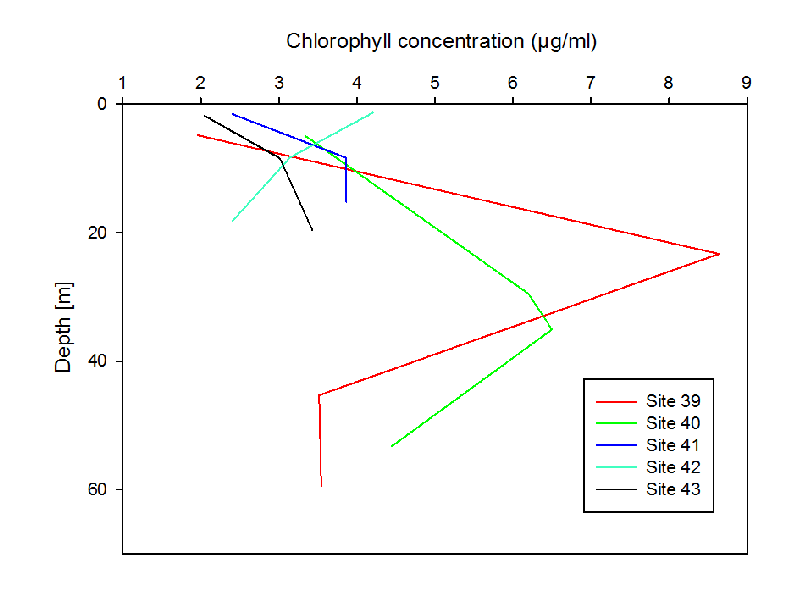
The overall trend of the graph is an increase in chlorophyll concentration with depth
up to a certain depth and then either a decrease or stabilisation in chlorophyll
concentration (Fig. 5). Site 39, the sampling site that was furthest offshore, shows
a distinct chlorophyll maximum between 20-
The large chlorophyll maximum at Site 39 is at the same depth as the thermocline and halocline, which suggests that water is not mixing from above and below this depth. Therefore, the chlorophyll maximum is possibly due to the sinking and accumulation of phytoplankton at this depth.
Fig. 1 Phosphate concentration with depth for five offshore sampling sites within the Fal and Helford Bay
Fig. 2 Nitrate concentration with depth for five offshore sampling sites within the Fal and Helford Bay
Fig. 3 Silicon concentration with depth for five offshore sampling sites within the Fal and Helford Bay
Fig. 4 Oxygen saturation with depth for five offshore sampling sites within the Fal and Helford Bay
Fig. 5 Chlorophyll concentration with depth for five offshore sampling sites within the Fal and Helford Bay