
Biological Analysis
Phytoplankton
Zooplankton
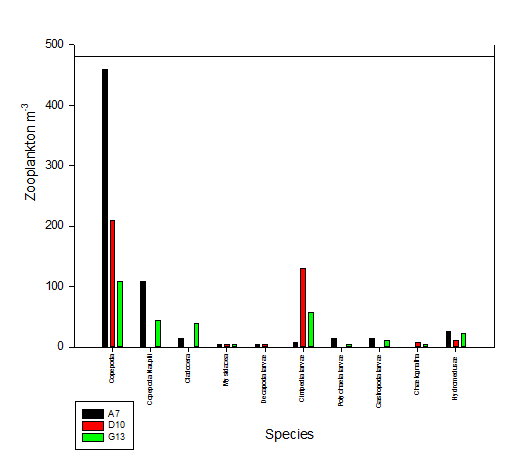
10ml of water from each of the three nets measured was put under a microscope in order to identify the zooplankton present. The results show that copepods were present in the highest abundance for all three sample sites (Fig. 1). The first sample site (A7), the furthest point upstream in the estuary, had the highest abundance of Copepoda and Copepod naupalli over all the sites. It contained more Hydromedusae and polychaete larvae than the other sites. The middle site (D10) had higher numbers of cirripedia larvae and Chaetognatha than the other sites as well as no Copepoda naupalli, Cladocera, Polychaeta or gastropoda larvae. The last sample site (G13) had the lowest number of Copepoda out of the sites but highest numbers of cladocera. It also had more cirripedia larvae than site 1 and Copepoda naupalli than site 2.
Overall this shows that with increased salinity, the zooplankton abundance decreases but diversity seems to increase slightly. This corresponds with low numbers of phytoplankton at the top of the estuary where they would be consumed by the zooplankton giving them energy for more growth and reproduction showing food availability is a factor in distribution (Viera et al, 2003). Turbidity is another factor influencing distribution which decreased down the estuary. Copepoda are planktonic feeders and turbidity can increase the prey encountered and thus ingestion (Islam et al, 2006). High amounts of suspended particles may also give camouflage to the copepods from predators (Haertel and Osterberg, 1967). Other zooplankton however appear to have a negative relationship with turbidity.
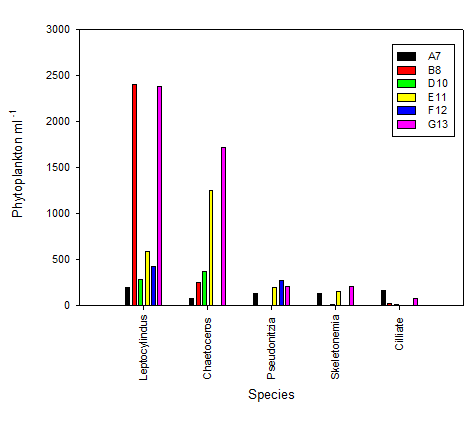
1ml of sample from each site were measured under a microscope for species ID. Phytoplankton abundance appears to increase towards the mouth of the estuary and seems to have a positive relationship with salinity (Fig. 1). Leptocylindus seems to increase regularly with the exception of B8 that has a much larger value. Chaetoceros also increases regularly with salinity. Pseudonitzia and Skeletonemia both increase with salinity but at some stations there were none present. Finally, ciliate was present greatest abundance in the first station (A7) compared to the rest.
Phosphate and Nitrate are essential nutrients for phytoplankton and are required for growth. Skeletonemia are a form of diatom which have a high uptake of silicon for their tests. Nutrients and phytoplankton have a negative relationship since when phytoplankton abundance is high, the nutrient concentration is low. This relationship can be seen in our results because while phytoplankton increase with salinity, nutrients decrease. It is thought that growth in freshwater may be limited by high turbidity from river input (Sin et al., 2000). This is balanced by higher temperature and light in the estuary. However, the abundance and diversity changes throughout the estuary depending on these factors and the individual species adaptations.
Fig. 1 Genera of phytoplankton sampled at six locations along the Fal Estuary
Fig. 1 Genera of zooplankton sampled at three locations along the Fal Estuary
References
Haertel and Osterberg (1967) Ecology of Zooplankton, Benthos and Fishes in the Columbia
River Estuary. Ecology, 48: 459-
Islam, Ueda and Tanaka (2006) Spatial and Seasonal variations in copepod communities
related to turbidity maximum along the Chikugo estuarine gradient in the upper Ariake
bay, Japan. Estuarine, Coastal and Shelf science, 68: 113-
Sin, R. Wetzel and I. Anderson (2000) Seasonal variations of size fractionated phytoplankton
along the salinity gradient in the York River estuary, Virginia (USA). Journal of
Plankton Research, 22: 1945-
Vieira, Azeiterio, Re and Morgado (2003) Zooplankton distribution in a temperate
estuary. Acta Oecologica, 24: 163-