
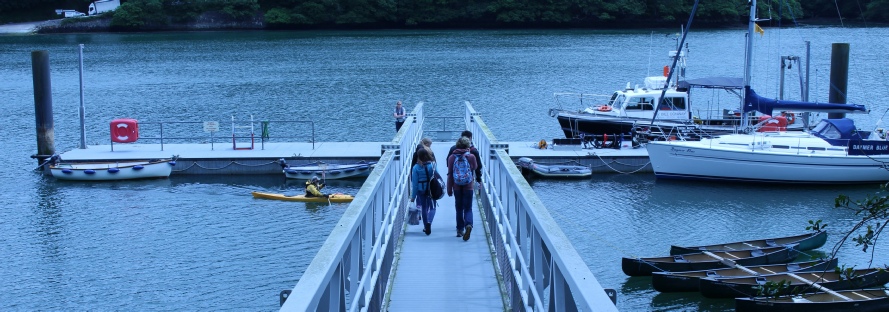
Pontoon
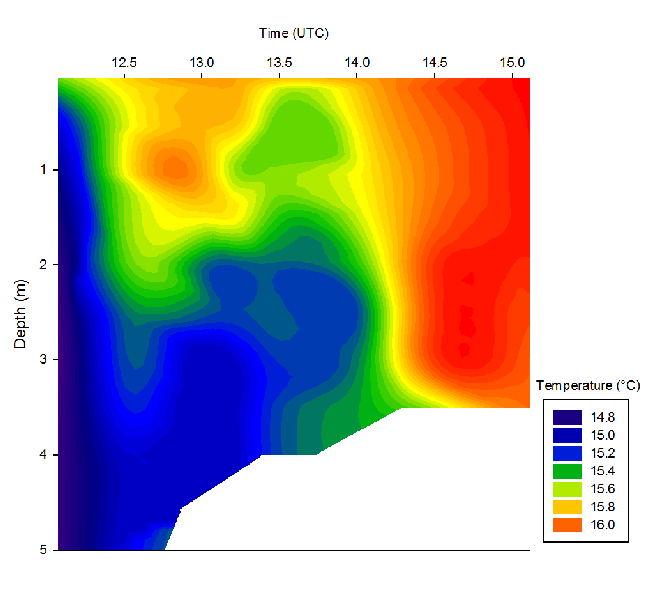
Temperature
Salinity
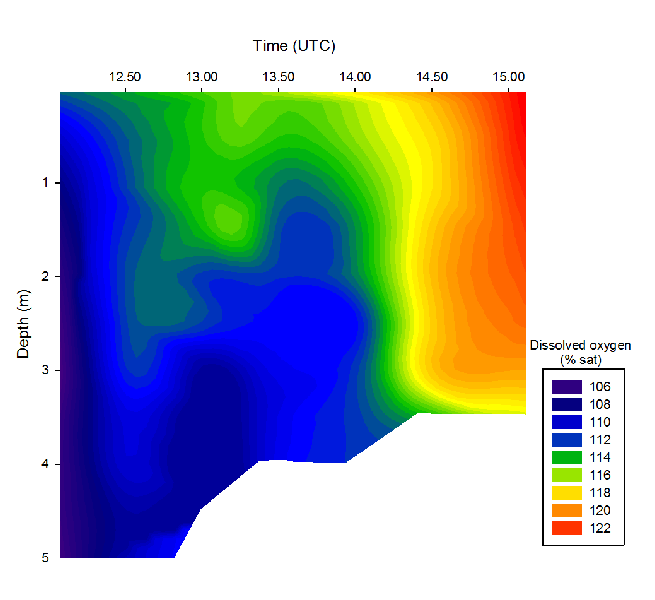
Dissolved Oxygen
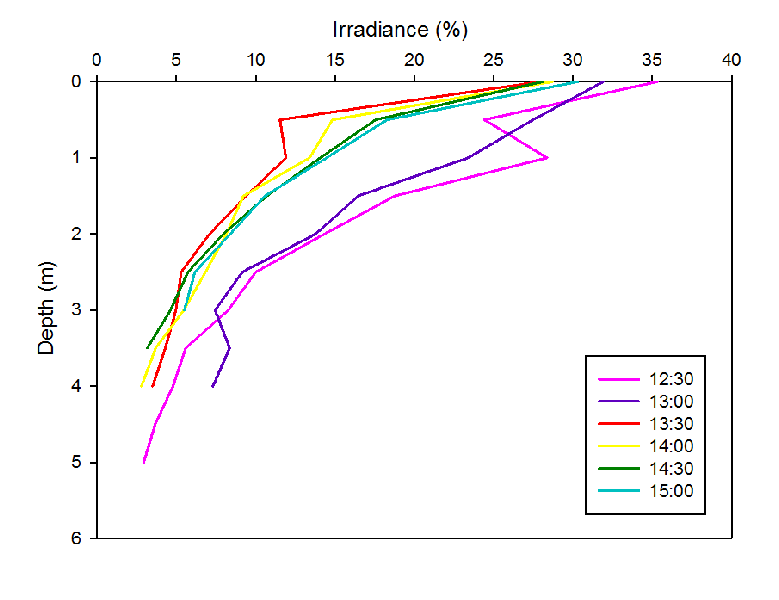
Irradiance
Fig. 5 Attenuation of light with depth through time at the pontoon on 26/06/2016
An exponential decrease of light with depth was observed throughout the time series (fig. 5). A lower irradiance was measured at 12:00 UTC and 13:00 UTC compared to all other sampling times. This is likely due to greater cloud cover (7/8) until 13:00 which cleared to 4/8 cloud cover by 13:30.
Aim
To measure the physical changes from a stationary point in the Fal Estuary over the course of 3 hours.
Objectives
To investigate the change in chlorophyll, flow, temperature, salinity, oxygen and irradiance with depth over the course of the afternoon.
Introduction
On the 27th June 2016 we arrived at the pontoon in the Fal estuary at 12.00 UTC. The weather was dry with 7/8 cloud cover on arrival but cleared to 4/8 and sun throughout the day. High water was at 09:56 (4.4m), low water at 16:23 (1.2m) and second high water at 22:21 (4.6m).
Methodology
For each piece of equipment, we took measurements every half hour between 12:00 – 15:00 UTC also recording times the ferry and other boats passed. For the niskin bottle we deployed at every 0.5m up to 5m each half hour depending on the depth which decreased throughout the day. We then took a sample of 50ml from each depth and passed it through a filter. The filter was then placed in acetone in labelled bottles. For the flow meter we lowered it to every 0.5m up to 5m depending on depth and wrote down speed (m) and direction (degrees) of the flow the machine gave. For the light meter we lowered it every 0.5m and recorded the surface and deep irradiance. For the exoprobe we lowered it every 0.5m up to 5m depending on depth which gave the time (UTC), temperature (degrees c), Salinity (psu), oxygen saturation (%), ODO (mg/L), PH and Depth (m). The calibration on some of the equipment used was incorrect. The salinity reading was 12psu higher than the actual so after collection we corrected for this. We also had to correct irradiance to get a percentage of depth over surface due to the probes having different sensitivities. Firstly we corrected irradiance at depth by multiplying by (799/776) and then divided this by surface irradiance and multiplied by 100 for a percentage answer.
Chlorophyll
Fig. 2 Temperature of the water column over time at the pontoon within the Fal Estuary on 26/06/2016
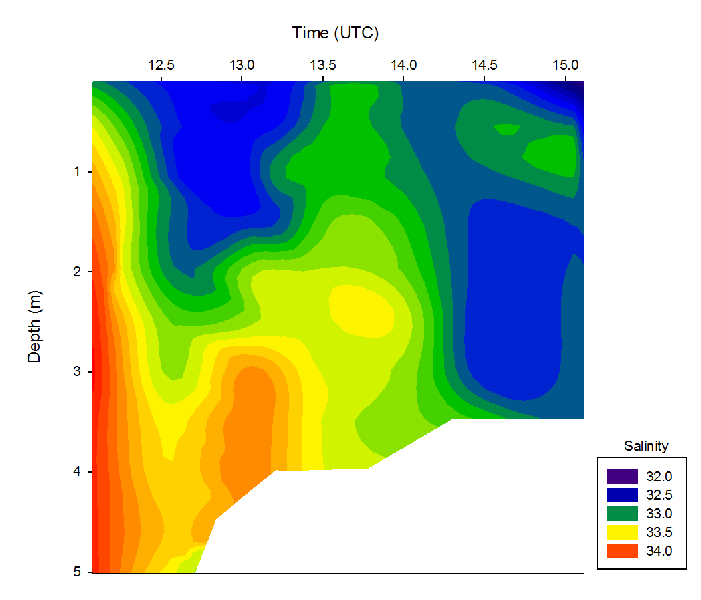
Fig. 1 Salinity of the water column over time at the pontoon within the Fal Estuary on 26/06/2016
Fig. 4 Dissolved Oxygen of the water column over time at the pontoon within the Fal Estuary on 26/06/2016
Flow
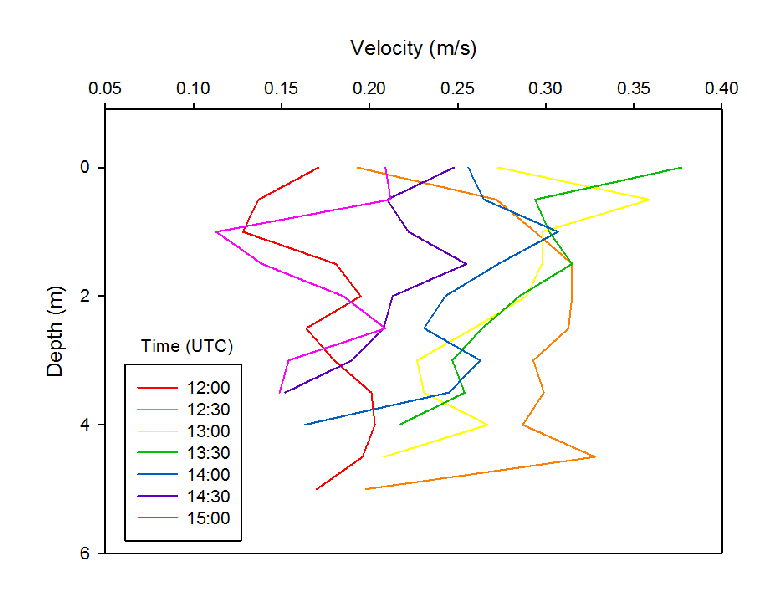
The flow velocity depth profiles at the pontoon were taken between high tide at 09:56 and low tide at 16:23. As the tide rushes out from high tide, surface velocities increase with time from 0.17m/s at 12:00 to 0.38m/s at 13:30. As the tidal cycle approaches low tide the flow slackens and surface velocities decrease from 0.38m/s at 13:30 to 0.21m/s at 15:00 close to low tide. In most of the depth profiles, maximum velocities can be seen between 0m and 2m and minimum velocities can be seen close to the riverbed. Increased friction between the water column and the riverbed is the reason for decreased velocities at the riverbed.
Equipment
Figure 1 shows that as time goes on and water depth decreases, salinity also decreases, from around 34 at 12:00 to 32 at 15:00. Figure 2 shows the inverse of figure 1; as time goes on temperature increases with decreasing depth, from 14.8 at 12:00 to 16 at 15;00. Figures 1 and 2 clearly show two bodies of water, warm fresh river water and cold saline seawater. As the tide goes out the saline seawater recedes out of the river pulling the fresh river water further downstream. Between 12:30 and 14:00, the warmer fresher river water can be seen to lie above of the more colder saline seawater, this is because the saline water is more dense and sinks to the bottom of the water column.
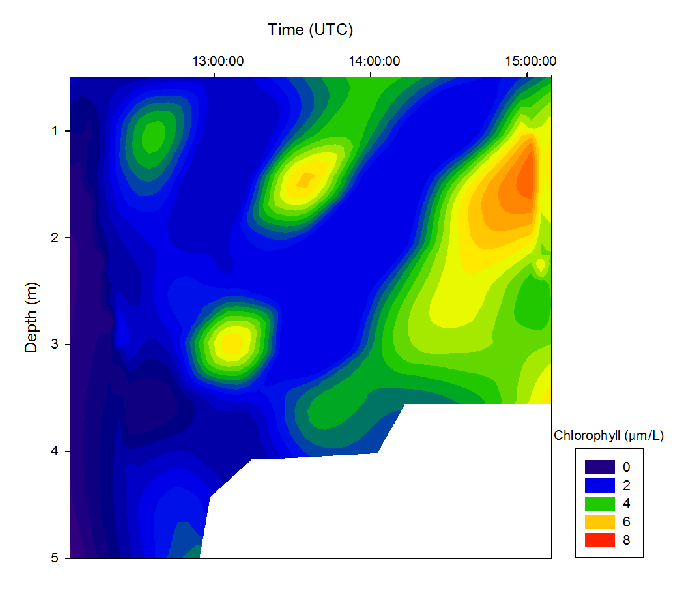
Figure 3 shows a similar pattern to figures 1 and 2, with chlorophyll increasing
from 0 at 12:00 up to 6-
Fig. 3 Chlorophyll concentration of the water column over time at the pontoon within the Fal Estuary on 26/06/2016
Light meter
There are two sensors connected to the reader(manufactured by Li-
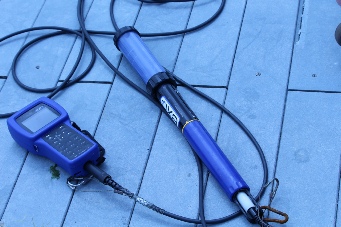
Exo probe
The probe is fitted with multiple sensors such as conductivity, temperature, dissolved oxygen, depth (pressure) and is lowered into the water column to create profiles from the physical parameters as mentioned.
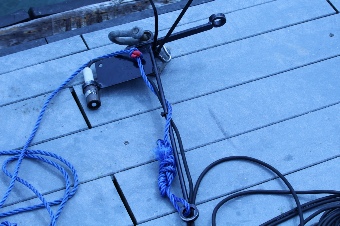
Niskin bottle
Typically, a 1L PVC bottle with two openings which are closed by a trigger and collects water sample at certain depth.
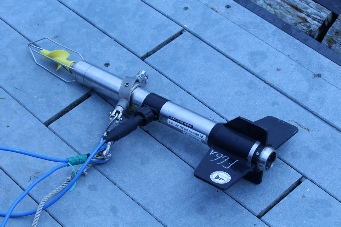
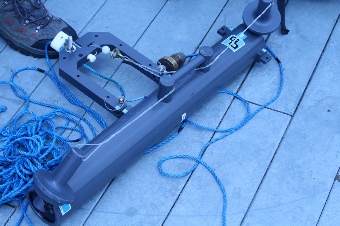
Flometer
This device is used to measure the flow rate of liquid passing through which rotates the propeller.
Flow Meter
Niskin Bottle
Exo Probe
Light Meter
Fig. 6 Velocity of flow depth through time at the pontoon on 26/06/2016